Unlock a world of possibilities! Login now and discover the exclusive benefits awaiting you.
- Qlik Community
- :
- All Forums
- :
- QlikView App Dev
- :
- Re: qlikview-barchart
- Subscribe to RSS Feed
- Mark Topic as New
- Mark Topic as Read
- Float this Topic for Current User
- Bookmark
- Subscribe
- Mute
- Printer Friendly Page
- Mark as New
- Bookmark
- Subscribe
- Mute
- Subscribe to RSS Feed
- Permalink
- Report Inappropriate Content
qlikview-barchart
Hello,guys:
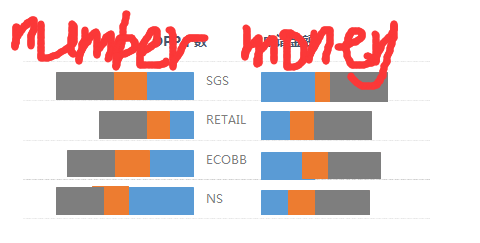
I wanna do this kind of bar chart with qlikview, maybe i have to do two bar charts, but how can i finish the left one,the axes is on the right,so do you guys have any ideas?
BTY, there are two KPIs and a dimension.
Thanks
- « Previous Replies
-
- 1
- 2
- Next Replies »
Accepted Solutions
- Mark as New
- Bookmark
- Subscribe
- Mute
- Subscribe to RSS Feed
- Permalink
- Report Inappropriate Content
Continuation should be. As i understand, User want to see the values in +Ve values
1) so you need to arrange the format from Number tab of each expression is Integer ---> #,##0; #,##0
2) Same as Sales Person
3) Sort Tab -- Y-Value --> Ascending
4) From Axis Tab - Each expression width should be o Pixel
Good Luck 
- Mark as New
- Bookmark
- Subscribe
- Mute
- Subscribe to RSS Feed
- Permalink
- Report Inappropriate Content
Hello,
If your dimension is coming from One table. Then it's easy. (PFA for ref)
If your dimension coming from two tables then it takes bit risk. That time we need to create two charts and then merge those two graphs.
- Mark as New
- Bookmark
- Subscribe
- Mute
- Subscribe to RSS Feed
- Permalink
- Report Inappropriate Content
Use horizontal bar charts and add expressions might achieve this, but i have never tried to make a symmetric before.
- Mark as New
- Bookmark
- Subscribe
- Mute
- Subscribe to RSS Feed
- Permalink
- Report Inappropriate Content
Yes,Anil,the dimension is from one table.I wanna create two charts then merge those two grahs,but i don't know how to create the left chart,because the axes is on the right.so, do you have any idea? Thanks
- Mark as New
- Bookmark
- Subscribe
- Mute
- Subscribe to RSS Feed
- Permalink
- Report Inappropriate Content
Thanks, I know i can't finish it with one chart,so i wannt create two charts and then merge them,and the right one is easy to create, but i don't know how to create the left one,you know the axes is on the right.Do you have any idea about the left one chart. Thanks!
- Mark as New
- Bookmark
- Subscribe
- Mute
- Subscribe to RSS Feed
- Permalink
- Report Inappropriate Content
Can you please share me your sample App with Dimensions and Expressions
OR
Send me raw data with the Used dimensions and Calc Dimensions
- Mark as New
- Bookmark
- Subscribe
- Mute
- Subscribe to RSS Feed
- Permalink
- Report Inappropriate Content
Hello Anil:
I just made a demo, and i wanna finish the printscreen result,but i don't know how to do it.
Just check the attachment.
Thanks for your help.
Best Regards
王传峰 | Ryan Wang
M. 13718050927
ryan.wang@analyticservice.net
- Mark as New
- Bookmark
- Subscribe
- Mute
- Subscribe to RSS Feed
- Permalink
- Report Inappropriate Content
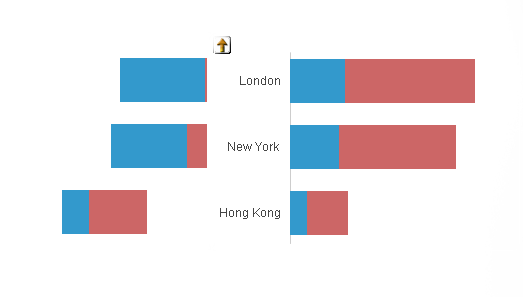
Like this,
- Mark as New
- Bookmark
- Subscribe
- Mute
- Subscribe to RSS Feed
- Permalink
- Report Inappropriate Content
Yes, Anil,that's great.Can you tell me how can I create chart like this
- Mark as New
- Bookmark
- Subscribe
- Mute
- Subscribe to RSS Feed
- Permalink
- Report Inappropriate Content
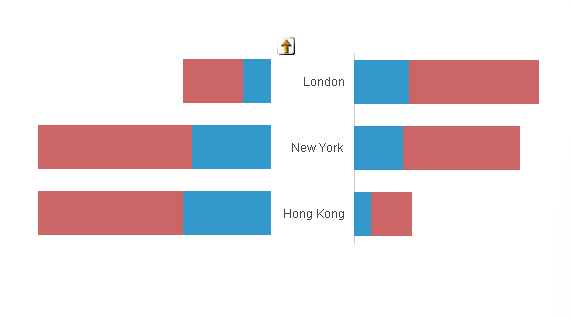
Try This..
You have only one chart, But why this file showing 27MB.
Anyway, Check these options, Please?
- ANIL
- « Previous Replies
-
- 1
- 2
- Next Replies »