Unlock a world of possibilities! Login now and discover the exclusive benefits awaiting you.
- Qlik Community
- :
- All Forums
- :
- QlikView App Dev
- :
- ratio test (significant test- ttest)
- Subscribe to RSS Feed
- Mark Topic as New
- Mark Topic as Read
- Float this Topic for Current User
- Bookmark
- Subscribe
- Mute
- Printer Friendly Page
- Mark as New
- Bookmark
- Subscribe
- Mute
- Subscribe to RSS Feed
- Permalink
- Report Inappropriate Content
ratio test (significant test- ttest)
Hi All,
I'm planning to use QV for marketing research.
I just wonder that; can I compare ratio's in order to whether there is significantly differences btw the periods.
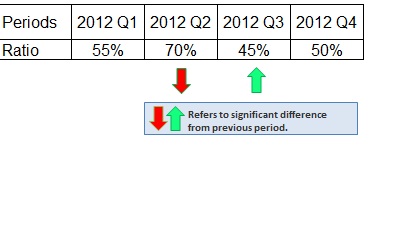
For better understanding pls look sample in below, I want to compare ratios according to 95% significant level.
| Periods | 2012 Q1 | 2012 Q2 | 2012 Q3 | 2012 Q4 |
| Ratio | 55% | 70% | 45% | 50% |
Does anyone use it at QV?
Thanks in advance.
- Mark as New
- Bookmark
- Subscribe
- Mute
- Subscribe to RSS Feed
- Permalink
- Report Inappropriate Content
Hi,
You can create a trend/line chart and compare these ratios against the given periods.
Use period as dimension and avg(ratio) as expression, you will get a line chart which will help you in comparing the ratio.
Hope this is helps.
Regards,
Amay
- Mark as New
- Bookmark
- Subscribe
- Mute
- Subscribe to RSS Feed
- Permalink
- Report Inappropriate Content
Hi Amay,
Thanks for your reply.
It would be good graph but I want to compare ratios with significant test(%95).
In below pls you can see Output in my mind .
BR,
Cagri
- Mark as New
- Bookmark
- Subscribe
- Mute
- Subscribe to RSS Feed
- Permalink
- Report Inappropriate Content
Hi Cagri,
You can use visual cues option that is present in pivot chart.
Or you can show an image instead of values based on your condition in expression.(I wont be able to provide sample app becoz qlikview is not thr on my sys  )
)
Regards,
Amay
- Mark as New
- Bookmark
- Subscribe
- Mute
- Subscribe to RSS Feed
- Permalink
- Report Inappropriate Content
Amay thanks for your kindly comments but I want to do it aoutomatically.
- Mark as New
- Bookmark
- Subscribe
- Mute
- Subscribe to RSS Feed
- Permalink
- Report Inappropriate Content
I think you need to use Chi2Test_p function to do the test,