Unlock a world of possibilities! Login now and discover the exclusive benefits awaiting you.
- Qlik Community
- :
- All Forums
- :
- QlikView App Dev
- :
- Re: reference line expression
- Subscribe to RSS Feed
- Mark Topic as New
- Mark Topic as Read
- Float this Topic for Current User
- Bookmark
- Subscribe
- Mute
- Printer Friendly Page
- Mark as New
- Bookmark
- Subscribe
- Mute
- Subscribe to RSS Feed
- Permalink
- Report Inappropriate Content
reference line expression
Hi all,
first of all thanks for any and all help its much appreciated.
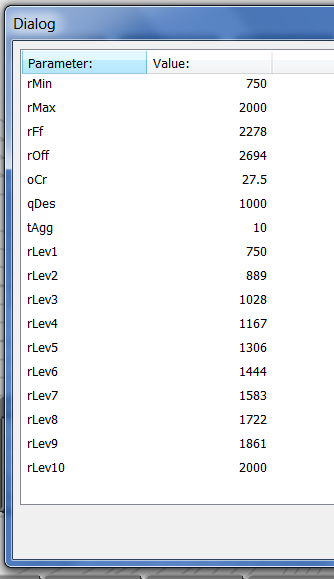
I want to add a reference line onto a chart but I want the reference line to be a value from an excel table.
this table is not releated to the data on the chart and a lookup in the script seems to take FARRRRR too long so thats out.
id like the line to show the value of RLev10 in the table.
| Parameter: | Value: |
| RLev10 | 750 |
thanks for any help.
- Tags:
- new_to_qlikview
- « Previous Replies
-
- 1
- 2
- Next Replies »
- Mark as New
- Bookmark
- Subscribe
- Mute
- Subscribe to RSS Feed
- Permalink
- Report Inappropriate Content
The expression is red, meaning it cant find the field in the datamodel.
Make sure you have load the field value from the Excel sheet.
Eventual you can upload a sample of the qvw file.
- Mark as New
- Bookmark
- Subscribe
- Mute
- Subscribe to RSS Feed
- Permalink
- Report Inappropriate Content
Your expression needs to be = 750, or if you want to make it more variable make it equal to a variable that you then give the value of 750 to
- Mark as New
- Bookmark
- Subscribe
- Mute
- Subscribe to RSS Feed
- Permalink
- Report Inappropriate Content
if you laded your excel and it has 1 record and the name of the field is Value (Value=750), put
Value in expression
- Mark as New
- Bookmark
- Subscribe
- Mute
- Subscribe to RSS Feed
- Permalink
- Report Inappropriate Content
thats because my Field is named Paramater and the record is rLev10, their are obviously other records in this table but for this reference line I only require rLev10, apologies if that wasnt clear
- Mark as New
- Bookmark
- Subscribe
- Mute
- Subscribe to RSS Feed
- Permalink
- Report Inappropriate Content
Your Rlev10 does not exist as it has a red underline in the window. I think that this is just a problem of spelling or upper/lower case - these need to be exact. I would suggest selecting RLev10 from your field names already defined in your expression.
- Mark as New
- Bookmark
- Subscribe
- Mute
- Subscribe to RSS Feed
- Permalink
- Report Inappropriate Content
rLev10 really does exist and im 100% ive spet it correct, the reason it is red is because it is a record not a field.
- Mark as New
- Bookmark
- Subscribe
- Mute
- Subscribe to RSS Feed
- Permalink
- Report Inappropriate Content
the expression should be
=only( {1 <Parameter={RLev10}>} Value)
example in the attachment
- Mark as New
- Bookmark
- Subscribe
- Mute
- Subscribe to RSS Feed
- Permalink
- Report Inappropriate Content
Thank You very much, I sense that was far more difficult than it should be lol,
have a nice day
- Mark as New
- Bookmark
- Subscribe
- Mute
- Subscribe to RSS Feed
- Permalink
- Report Inappropriate Content
See Massimo Grossi answer - sorry had not realised it was a parameter inside a table.
- « Previous Replies
-
- 1
- 2
- Next Replies »