Unlock a world of possibilities! Login now and discover the exclusive benefits awaiting you.
- Qlik Community
- :
- All Forums
- :
- QlikView App Dev
- :
- result of avg() dimension differs from expectation
- Subscribe to RSS Feed
- Mark Topic as New
- Mark Topic as Read
- Float this Topic for Current User
- Bookmark
- Subscribe
- Mute
- Printer Friendly Page
- Mark as New
- Bookmark
- Subscribe
- Mute
- Subscribe to RSS Feed
- Permalink
- Report Inappropriate Content
result of avg() dimension differs from expectation
Dear all,
I have difficulties with the AVG() function.
I created an expression which gives me a coverage
Expression "coverage":
Count({$<PCHA_VALUE_GB-={'-'}>}PBGA_BG_NO) / max(aggr(nodistinct Count(PBGA_BG_NO), PAGA_GA_ID))
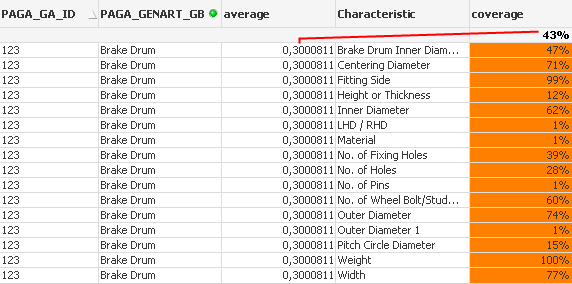
Now I want to calculate the average of this expression as a dimension but the result differs from the total average I can set in the presentation tab:
Dimension "average"
avg(total aggr(Count({$<PCHA_VALUE_GB-={'-'}>}PBGA_BG_NO) / max(aggr(nodistinct Count(PBGA_BG_NO), PAGA_GA_ID)), PCHA_CHAR_ID, PAGA_GA_ID))
My expectation is that I receive 0,43. Instead I receive 0,3000811.

Any help is appreciated.
Thanks.
- « Previous Replies
-
- 1
- 2
- Next Replies »
- Mark as New
- Bookmark
- Subscribe
- Mute
- Subscribe to RSS Feed
- Permalink
- Report Inappropriate Content
- Mark as New
- Bookmark
- Subscribe
- Mute
- Subscribe to RSS Feed
- Permalink
- Report Inappropriate Content
Yes it was my bad once again.... remove TOTAL qualifier...
Aggr(
Avg({<PCHA_PUBL = {1}>} TOTAL Aggr(

Count({$<PCHA_VALUE_GB -= {'-'}, PCHA_PUBL = {1}>} PBGA_BG_NO)/
Max({<PCHA_PUBL = {1}>}Aggr(NODISTINCT Count({<PCHA_PUBL = {1}>}PBGA_BG_NO), PAGA_GA_ID))

, PCHA_CHAR_ID, PAGA_GA_ID, PCHA_CHAR_GB))
, PAGA_GA_ID)
- Mark as New
- Bookmark
- Subscribe
- Mute
- Subscribe to RSS Feed
- Permalink
- Report Inappropriate Content
I hope I can utilise this for all the according calculations I need.
- Mark as New
- Bookmark
- Subscribe
- Mute
- Subscribe to RSS Feed
- Permalink
- Report Inappropriate Content
Hi Sunny,
My aplogies for coming up with this topic again but I encounter another issue with this since the values differ.
Having one PAGA_GA_ID selected everything is OK, but having multiple PAGA_GA_ID selected, the values differ and I can't even reproduce how they have been calculated.


My efforts to alter the most outer aggregation in terms of fields to be considered failed and I can't find anything helpful in the community board.
May you assist me once more?
Thanks
- Mark as New
- Bookmark
- Subscribe
- Mute
- Subscribe to RSS Feed
- Permalink
- Report Inappropriate Content
It would be easier to help if you are able to share your qvw file.
- Mark as New
- Bookmark
- Subscribe
- Mute
- Subscribe to RSS Feed
- Permalink
- Report Inappropriate Content
Hi Sunny,
to share the file is rather difficult (company data) and I have no idea how I could break it down best possible. Maybe a further explanation helps:
In this chart I calculate a coverage and my focus is the coverage proposed ch..(..aracteristics)

I populated the dimension "coverage all characteristics" successully with the expression in the picture (again here):
=num(Aggr(
Avg({<PCHA_PUBL = {1}>} Aggr(
Count({$<PCHA_VALUE_GB -= {'-'}, PCHA_PUBL = {1}>} PBGA_BG_NO)/
Max({<PCHA_PUBL = {1}>}Aggr(NODISTINCT Count({<PCHA_PUBL = {1}>}PBGA_BG_NO), PAGA_GA_ID))
, PCHA_CHAR_ID, PAGA_GA_ID, PCHA_CHAR_GB))
, PAGA_GA_ID), '##0,0 %')
The oly distinguishing fact between the two columns " coverage all..." and "coverage proposed..." is that proposed needs an additional condition where I delimit the characteristics (PCHA_CHAR_ID) that exceed a certain count since they also exist in another field:
PCHA_CHAR_ID = {"=Count(DISTINCT PCHA_CHAR_ID=PCGA_CHAR_ID) > 1"}
These are the orange columns of the second row and this is what I need the average of.
I think it all comes down to the question where to add this line into the statement more above to make it work since the dimension "coverage all characteristics" is working.
Even when I currently select a certain value, the result is wrong since I expect 45.75% as "coverage proposed..." but end up with 47.3%

I hope this helps.
- Mark as New
- Bookmark
- Subscribe
- Mute
- Subscribe to RSS Feed
- Permalink
- Report Inappropriate Content
What exactly is this saying?
PCHA_CHAR_ID = {"=Count(DISTINCT PCHA_CHAR_ID=PCGA_CHAR_ID) > 1"}I don't think I understand the issue to be able to respond you with the correct expression.
- Mark as New
- Bookmark
- Subscribe
- Mute
- Subscribe to RSS Feed
- Permalink
- Report Inappropriate Content
Hi Sunny,
just to inform you: The passage you mentioned caused more trouble than it helped so I overworked my data model to get rid of that calculation.
Thereby I was able to exchange
PCHA_CHAR_ID = {"=Count(DISTINCT PCHA_CHAR_ID=PCGA_CHAR_ID) > 1"}
to the much more useable PCGA_PROP = {1} and it now works fine in that particular chart.
=num(Aggr(
Avg({<PCHA_PUBL = {1}, PCGA_PROP={1}>} Aggr(
(Count({$<PCHA_VALUE_GB-={'-'}>}distinct PBGA_BG_NO) + Count({$<PCHA_IRRELEVANT= {1}>}distinct PBGA_BG_NO))
/
max(aggr(nodistinct Count(distinct PBGA_BG_NO), PAGA_GA_ID))
, PCHA_CHAR_ID, PAGA_GA_ID, PCHA_CHAR_GB))
, PAGA_GA_ID), '##0 %')
- Mark as New
- Bookmark
- Subscribe
- Mute
- Subscribe to RSS Feed
- Permalink
- Report Inappropriate Content
Sounds good. I am glad you managed to resolved this all by yourself 🙂
- « Previous Replies
-
- 1
- 2
- Next Replies »