Unlock a world of possibilities! Login now and discover the exclusive benefits awaiting you.
- Qlik Community
- :
- All Forums
- :
- QlikView App Dev
- :
- Re: scatter 3rd calc.
- Subscribe to RSS Feed
- Mark Topic as New
- Mark Topic as Read
- Float this Topic for Current User
- Bookmark
- Subscribe
- Mute
- Printer Friendly Page
- Mark as New
- Bookmark
- Subscribe
- Mute
- Subscribe to RSS Feed
- Permalink
- Report Inappropriate Content
scatter 3rd calc.
hi all,
i have a scatter chart with one dimension (cyclic) and 3 expressions one for each axes and one for bubble size (attached sample),
when standing on bubbles i see only two expressions and the dimension i want to add the third expression to the tooltip.
any ideas?
advanced thanks
Accepted Solutions
- Mark as New
- Bookmark
- Subscribe
- Mute
- Subscribe to RSS Feed
- Permalink
- Report Inappropriate Content
ilanbaruch & trdandamudi, In 11.20SR10 a bug with ID 69012 and title "Pop up text on scatter chart not show " (sic) was fixed. I think the description may have been cut short and may actually be related to what you are both experiencing.
Please try to upgrade to a later version of QV Desktop, by preference SR13. I think that should do the trick.
Best,
Peter
- Mark as New
- Bookmark
- Subscribe
- Mute
- Subscribe to RSS Feed
- Permalink
- Report Inappropriate Content
I do see all three expressions. Which version are you using?
![2016-04-25 22_28_33-QlikView x64 - [C__Users_Stefan_Downloads_scatter sample.qvw].png](/legacyfs/online/122662_2016-04-25 22_28_33-QlikView x64 - [C__Users_Stefan_Downloads_scatter sample.qvw].png)
- Mark as New
- Bookmark
- Subscribe
- Mute
- Subscribe to RSS Feed
- Permalink
- Report Inappropriate Content
11.2
is it possible??
- Mark as New
- Bookmark
- Subscribe
- Mute
- Subscribe to RSS Feed
- Permalink
- Report Inappropriate Content
I see one dimension and 3 expressions too. Using 11.20SR13
What comes after the 11.2?
- Mark as New
- Bookmark
- Subscribe
- Mute
- Subscribe to RSS Feed
- Permalink
- Report Inappropriate Content
11.20.12235.0409
Just can't check at the moment which SR this relates to.
- Mark as New
- Bookmark
- Subscribe
- Mute
- Subscribe to RSS Feed
- Permalink
- Report Inappropriate Content
hi , attached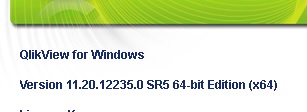
- Mark as New
- Bookmark
- Subscribe
- Mute
- Subscribe to RSS Feed
- Permalink
- Report Inappropriate Content
I can see only two expressions and I am using the version: Version 11.20.12664.0 SR9
- Mark as New
- Bookmark
- Subscribe
- Mute
- Subscribe to RSS Feed
- Permalink
- Report Inappropriate Content
ilanbaruch & trdandamudi, In 11.20SR10 a bug with ID 69012 and title "Pop up text on scatter chart not show " (sic) was fixed. I think the description may have been cut short and may actually be related to what you are both experiencing.
Please try to upgrade to a later version of QV Desktop, by preference SR13. I think that should do the trick.
Best,
Peter