Unlock a world of possibilities! Login now and discover the exclusive benefits awaiting you.
- Qlik Community
- :
- All Forums
- :
- QlikView App Dev
- :
- scatter Chart
Options
- Subscribe to RSS Feed
- Mark Topic as New
- Mark Topic as Read
- Float this Topic for Current User
- Bookmark
- Subscribe
- Mute
- Printer Friendly Page
Turn on suggestions
Auto-suggest helps you quickly narrow down your search results by suggesting possible matches as you type.
Showing results for
Partner - Creator
2016-02-02
12:15 AM
- Mark as New
- Bookmark
- Subscribe
- Mute
- Subscribe to RSS Feed
- Permalink
- Report Inappropriate Content
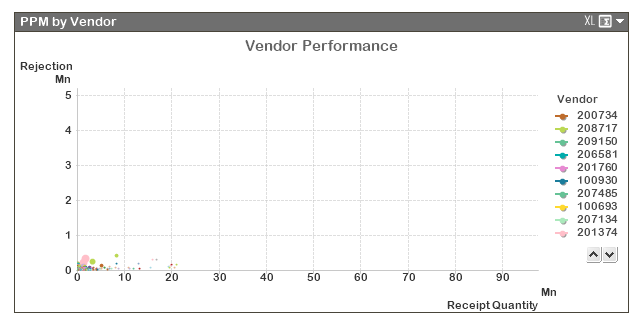
scatter Chart
Hi All,
I have created the Scatter chart for vendor performance and it showing the value near to 0 only. Please see that screen shot.
but in actual the value should more readable. if i use static scale then it is shows comparatively good or select vendor it show good.
Thanks......!
221
324 Views
3 Replies
MVP
2016-02-02
02:15 AM
- Mark as New
- Bookmark
- Subscribe
- Mute
- Subscribe to RSS Feed
- Permalink
- Report Inappropriate Content
Provide your sample app..
262 Views
Master III
2016-02-02
02:16 AM
- Mark as New
- Bookmark
- Subscribe
- Mute
- Subscribe to RSS Feed
- Permalink
- Report Inappropriate Content
Hi,
May be it is very small value (seems you are converting your value into million).. For testing, change your chart to Straight chart and check that..
Can you provide the sample?
262 Views
Master
2016-02-02
02:27 AM
- Mark as New
- Bookmark
- Subscribe
- Mute
- Subscribe to RSS Feed
- Permalink
- Report Inappropriate Content
Hi,
Go to Axes ->
At X-Axis -Log Scale
At Y-Axis -Log Scale
Hope this helps,
Hirish
HirisH
“Aspire to Inspire before we Expire!”
“Aspire to Inspire before we Expire!”
262 Views