Unlock a world of possibilities! Login now and discover the exclusive benefits awaiting you.
Announcements
Join us to spark ideas for how to put the latest capabilities into action. Register here!
- Qlik Community
- :
- All Forums
- :
- QlikView App Dev
- :
- Re: searching for bar chart to display timeslots i...
Options
- Subscribe to RSS Feed
- Mark Topic as New
- Mark Topic as Read
- Float this Topic for Current User
- Bookmark
- Subscribe
- Mute
- Printer Friendly Page
Turn on suggestions
Auto-suggest helps you quickly narrow down your search results by suggesting possible matches as you type.
Showing results for
Creator II
2013-01-09
10:40 AM
- Mark as New
- Bookmark
- Subscribe
- Mute
- Subscribe to RSS Feed
- Permalink
- Report Inappropriate Content
searching for bar chart to display timeslots in one row
Hi,
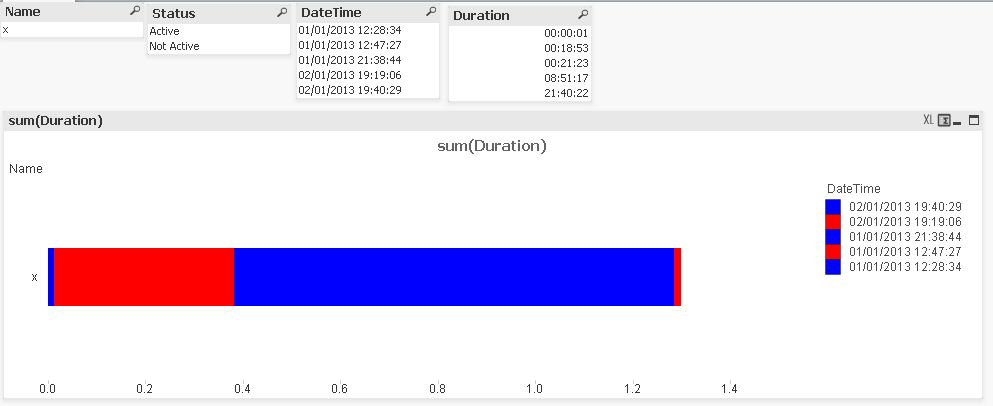
I am looking for a barchart which shows me a timeline which consist of 2 colours ( depends on status) which is showing over days.
in my data i have a name, status, starttime, duration
when you count starttime and duration this will result in the starttime of the next row (different status)
The bar chart will put all the timeslots behind each other to display a timeline with colours showing when was active and when not (status)
Hope someone can help me out!
See attached example.
Kind regards,
Linda Monincx
313 Views
1 Reply
Not applicable
2013-01-09
10:59 AM
- Mark as New
- Bookmark
- Subscribe
- Mute
- Subscribe to RSS Feed
- Permalink
- Report Inappropriate Content
Hi Linda,
This is the closest I could get
Regards!
241 Views