Unlock a world of possibilities! Login now and discover the exclusive benefits awaiting you.
- Qlik Community
- :
- All Forums
- :
- QlikView App Dev
- :
- show/display every month in chart
- Subscribe to RSS Feed
- Mark Topic as New
- Mark Topic as Read
- Float this Topic for Current User
- Bookmark
- Subscribe
- Mute
- Printer Friendly Page
- Mark as New
- Bookmark
- Subscribe
- Mute
- Subscribe to RSS Feed
- Permalink
- Report Inappropriate Content
show/display every month in chart
Hi guys,
How can I show every month in chart ?
I have a month chart with sum(amount) expression..
but it only shows up the month where an amount was made. the month without an amount, it doenst display/show up.
Is it possible to show all the Month that I've "selected"?
What about the rolling month? It also shows only the month where exist an amount.
Ive tried with the settings in chartsm to unselect and select show all values ...
but I still dont get it.
Is there for a simply trick/way to show this?, Ive also tried with
If(sum(amont=0), amount+0,01,sum(amount)
hope you guys can help me ![]()
- « Previous Replies
-
- 1
- 2
- Next Replies »
- Mark as New
- Bookmark
- Subscribe
- Mute
- Subscribe to RSS Feed
- Permalink
- Report Inappropriate Content
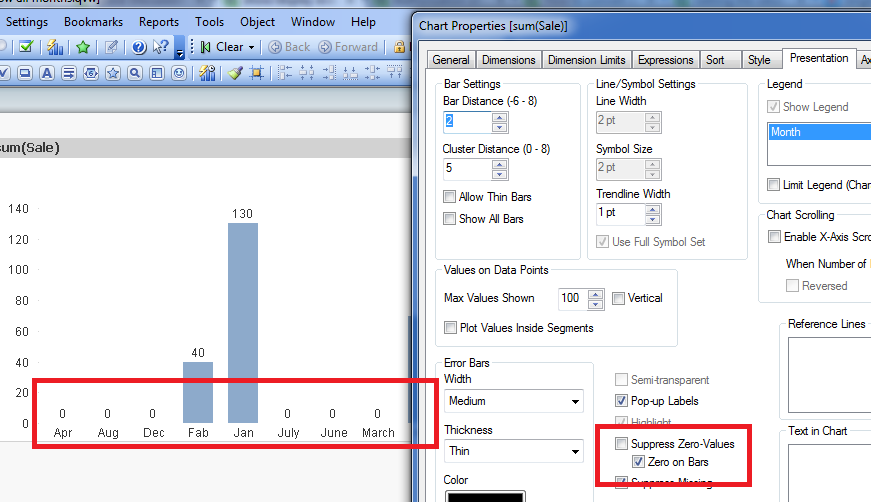
Hi, try to cncheck "Suppress Zero Value", and check "Zero on bars" on presentation tab...

- Mark as New
- Bookmark
- Subscribe
- Mute
- Subscribe to RSS Feed
- Permalink
- Report Inappropriate Content
Hi,
I did it, but it only shows up the month where is an amount ![]()
- Mark as New
- Bookmark
- Subscribe
- Mute
- Subscribe to RSS Feed
- Permalink
- Report Inappropriate Content
share the sample...?
and check do you have all months in the data base..?
- Mark as New
- Bookmark
- Subscribe
- Mute
- Subscribe to RSS Feed
- Permalink
- Report Inappropriate Content
well, I can't share, cause privacy data.
and yes, I've created that with the master calendar.
there are all months if I dont select something.
If I select the year 2014, with a customer x, so it only shows the month with amounts..
- Mark as New
- Bookmark
- Subscribe
- Mute
- Subscribe to RSS Feed
- Permalink
- Report Inappropriate Content
you can use scramble the data, by using "scrambling "in document properties...
select the field and click scramble...
- Mark as New
- Bookmark
- Subscribe
- Mute
- Subscribe to RSS Feed
- Permalink
- Report Inappropriate Content
I guess while creating master calender you have set for today() ,change it to
LET vDateMin = Num(MakeDate(1999,04,1));
LET vDateMax = Num(QuarterEnd(Now(),0,4));
LET vDateToday = Num(Now());
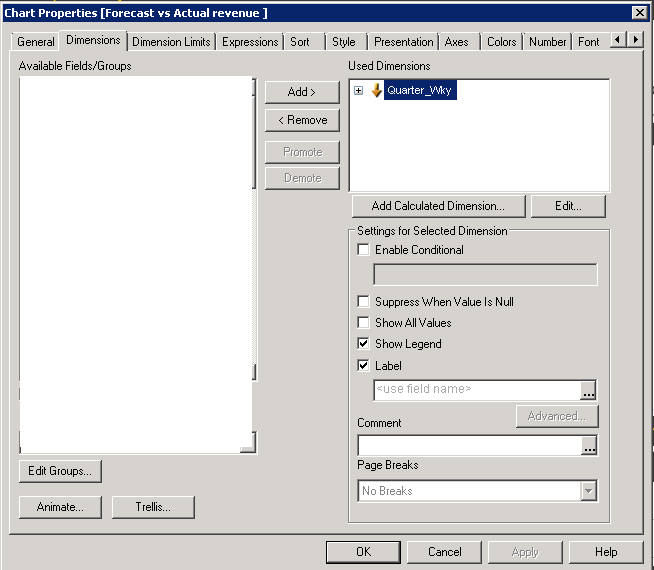
and in the properties pls enable show all values

- Mark as New
- Bookmark
- Subscribe
- Mute
- Subscribe to RSS Feed
- Permalink
- Report Inappropriate Content
The best option is to use continuous axis options. You do have to have a numeric value(i.e. a serial date based month)
- Mark as New
- Bookmark
- Subscribe
- Mute
- Subscribe to RSS Feed
- Permalink
- Report Inappropriate Content
If I select this show all values,
it shows every month of my rollingmonth,
but for example,
i want to show only the year 2014 oder 2012..
- Mark as New
- Bookmark
- Subscribe
- Mute
- Subscribe to RSS Feed
- Permalink
- Report Inappropriate Content
ip updated my post with the project,
an exampe is 'KHZBELS' in End Customer.
- its about the rolling months-
- « Previous Replies
-
- 1
- 2
- Next Replies »