Unlock a world of possibilities! Login now and discover the exclusive benefits awaiting you.
- Qlik Community
- :
- All Forums
- :
- QlikView App Dev
- :
- stacked and grouped chart
- Subscribe to RSS Feed
- Mark Topic as New
- Mark Topic as Read
- Float this Topic for Current User
- Bookmark
- Subscribe
- Mute
- Printer Friendly Page
- Mark as New
- Bookmark
- Subscribe
- Mute
- Subscribe to RSS Feed
- Permalink
- Report Inappropriate Content
stacked and grouped chart
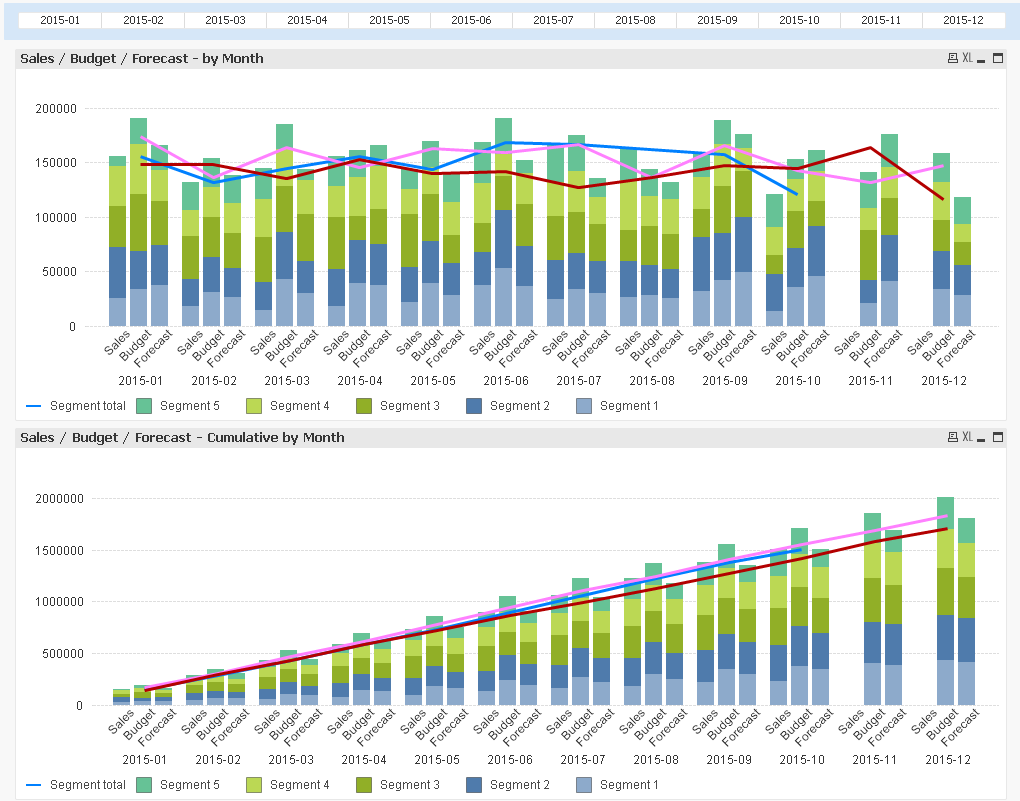
Obtaining a chart with clustered stacked columns by month, something as below :

For details , I have joined little excel file with random data and qlikview app - made with personal edition
For an overview, I have done in excel
- one sheet for mapping (to group) betwwen "segment" and "groups" (1 segment contains n groups)
- one "sheet" per Sales, Budget and Forecast, with similar crosstab to have "values" by both "group" and "month".
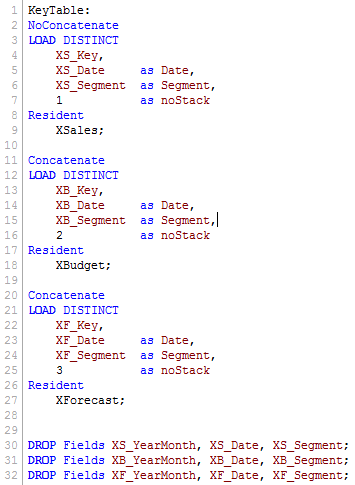
Then, after loaded all that, with "uncross" data, to 3 tables (Sales, Budget, Forecast)I have done a "keyTable" to join them
on "date" and "segment" and added a "noStack" to define associated stack in chart

Then, Dimension tab :

and Expressions tab :

If possible, main point I would like to make "dynamic" is about "measures" because I have done one measure per segment with segment code in the expression of measure.