Unlock a world of possibilities! Login now and discover the exclusive benefits awaiting you.
- Qlik Community
- :
- All Forums
- :
- QlikView App Dev
- :
- stacked bars
- Subscribe to RSS Feed
- Mark Topic as New
- Mark Topic as Read
- Float this Topic for Current User
- Bookmark
- Subscribe
- Mute
- Printer Friendly Page
- Mark as New
- Bookmark
- Subscribe
- Mute
- Subscribe to RSS Feed
- Permalink
- Report Inappropriate Content
stacked bars
Hi,
Please find the attached word document.
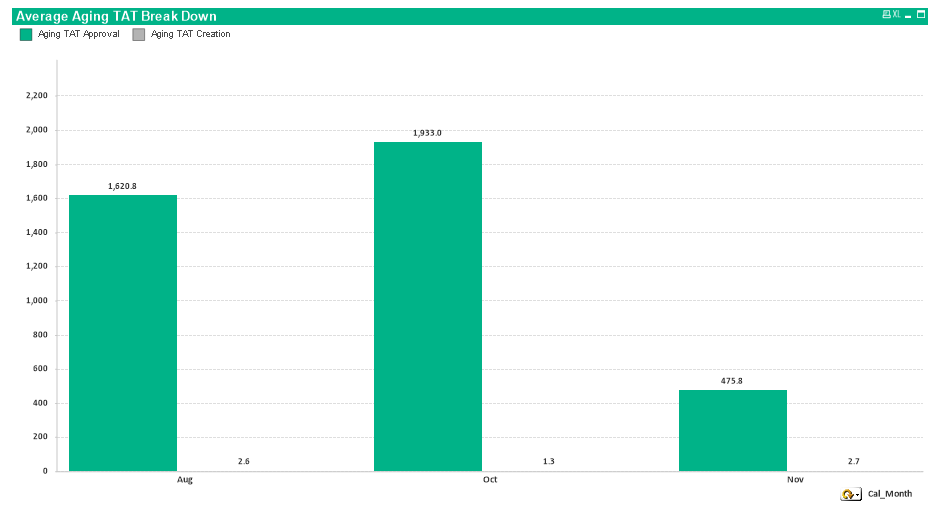
I have a bar chart with 2 expressions
1.avg(tat_approval)
2.avg(tat_creation)
and i want to show this data by a cyclic group of Month,Quarter,Year,Week and client also asked to show the segregation of data for different statuses(STATUS field) as well so i included that as 2nd dimension.
By default i'm getting a stacked bar with 2 bars(expressions) (Approval+Creation) with different bars for diff statuses. (Totally 10 stacked bars for 10 statuses under each month/week/year/quarter)
Now, what i want is can i show it as 2 stacked bars only under each month/week/quarter/year with stacked bars as statuses.
If possible, how can i achieve it ?
- « Previous Replies
-
- 1
- 2
- Next Replies »
- Mark as New
- Bookmark
- Subscribe
- Mute
- Subscribe to RSS Feed
- Permalink
- Report Inappropriate Content
Hi Adam,
Please provide the expression for that....
- Mark as New
- Bookmark
- Subscribe
- Mute
- Subscribe to RSS Feed
- Permalink
- Report Inappropriate Content
I want as like in 1st one but there i want 9 stacks in each bar, showing how much 1 particular status(stack) is contributing into the Approval/Creation . . .
- Mark as New
- Bookmark
- Subscribe
- Mute
- Subscribe to RSS Feed
- Permalink
- Report Inappropriate Content
For now, i didn't face any issue as the development of this dashboard is started recently but in future they are planning to include many things in this.
Okay, anyhow i will follow this approach for now.
If i face any issues in future, need to look for some other solution.
Thank You for your support..
- Mark as New
- Bookmark
- Subscribe
- Mute
- Subscribe to RSS Feed
- Permalink
- Report Inappropriate Content
Thank You Adam and Dinesh for your support..
- Mark as New
- Bookmark
- Subscribe
- Mute
- Subscribe to RSS Feed
- Permalink
- Report Inappropriate Content
Hi Mohan,
I think, you want like this.
- « Previous Replies
-
- 1
- 2
- Next Replies »