Unlock a world of possibilities! Login now and discover the exclusive benefits awaiting you.
- Qlik Community
- :
- All Forums
- :
- QlikView App Dev
- :
- Re: sum last 3 days sale
- Subscribe to RSS Feed
- Mark Topic as New
- Mark Topic as Read
- Float this Topic for Current User
- Bookmark
- Subscribe
- Mute
- Printer Friendly Page
- Mark as New
- Bookmark
- Subscribe
- Mute
- Subscribe to RSS Feed
- Permalink
- Report Inappropriate Content
sum last 3 days sale
Dears,
I have dummy data as below

and I need to calculate last 3 days sales by date, expect output:

please help , thanks
- Mark as New
- Bookmark
- Subscribe
- Mute
- Subscribe to RSS Feed
- Permalink
- Report Inappropriate Content
Try this
RangeSum(Above(Sum(Sales), 0, 3))
- Mark as New
- Bookmark
- Subscribe
- Mute
- Subscribe to RSS Feed
- Permalink
- Report Inappropriate Content
Or this
RangeSum(Above(Sum({<Date>}Sales), 0, 3)) * Avg(1)
- Mark as New
- Bookmark
- Subscribe
- Mute
- Subscribe to RSS Feed
- Permalink
- Report Inappropriate Content
Hey Sunny,
Can you explain why you would use this expression?
- Mark as New
- Bookmark
- Subscribe
- Mute
- Subscribe to RSS Feed
- Permalink
- Report Inappropriate Content
I guess can I ask you why would you not want to use this if it gives you what you want? I mean do you have an alternative way to do it? I know this can be done with The As-Of Table or something similar in the script, but do you have a better way to do this?
- Mark as New
- Bookmark
- Subscribe
- Mute
- Subscribe to RSS Feed
- Permalink
- Report Inappropriate Content
I'm sorry, I was just wondering what the differences between your first suggestion and second suggestion are. I didnt understand the avg(1). Thought I might learn a thing or two.
- Mark as New
- Bookmark
- Subscribe
- Mute
- Subscribe to RSS Feed
- Permalink
- Report Inappropriate Content
Without selection in Date field the result of the two expression will be the same. The difference arises when you select a single date or multiple dates. 1st expression will restart the accumulation based on selection, where as the 2nd expression will only show the dates you have selected, but will show accumulation from the beginning of time.
- Mark as New
- Bookmark
- Subscribe
- Mute
- Subscribe to RSS Feed
- Permalink
- Report Inappropriate Content
Hi Dave,
You can solve your problem without RangeSum function, for this you should do the following:
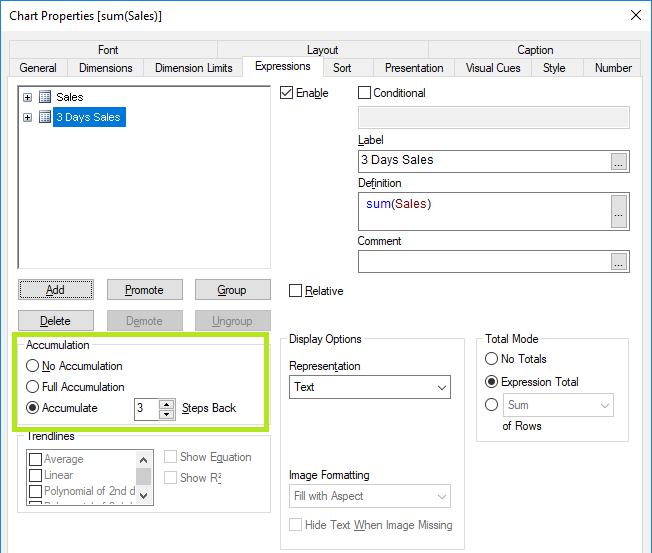
1. Create additional expression Sum(Sales)
2. Use Accumulation and Accumulate 3 Steps Back

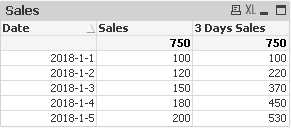
After this you will get following result:

Thanks,
Vitalii
- Mark as New
- Bookmark
- Subscribe
- Mute
- Subscribe to RSS Feed
- Permalink
- Report Inappropriate Content
Hi Sunny
the 2nd expression is so cool ! it's really a smart use of Avg(1)
the only problem is , user can not order the table by Date desc , or order by sales volume right ?
is there any chance to fix this ? or we have to do it in Script ?
- Mark as New
- Bookmark
- Subscribe
- Mute
- Subscribe to RSS Feed
- Permalink
- Report Inappropriate Content
If it has to be by Date descending... then just change Above() to Below()
RangeSum(Below(Sum({<Date>}Sales), 0, 3)) * Avg(1)