Unlock a world of possibilities! Login now and discover the exclusive benefits awaiting you.
- Qlik Community
- :
- All Forums
- :
- QlikView App Dev
- :
- Re: sum({<[Process Date]={"$(=date(max([Process Da...
- Subscribe to RSS Feed
- Mark Topic as New
- Mark Topic as Read
- Float this Topic for Current User
- Bookmark
- Subscribe
- Mute
- Printer Friendly Page
- Mark as New
- Bookmark
- Subscribe
- Mute
- Subscribe to RSS Feed
- Permalink
- Report Inappropriate Content
sum({<[Process Date]={"$(=date(max([Process Date])-1,'MM/DD/YYYY'))"}>}[Sales Posting Amount USD]) is working for me
Hi,
I am using the below expression:
sum({<[Process Date]={"$(=date(max([Process Date])-1,'MM/DD/YYYY'))"}>}[Sales Posting Amount USD])
for previous day calculation. But I get 0. Please tell me what wrong in it.
my [Process Date] format is MM/DD/YYYY
I have modified my code and chart functions and have attached it for reference.
Please help me.
- Mark as New
- Bookmark
- Subscribe
- Mute
- Subscribe to RSS Feed
- Permalink
- Report Inappropriate Content
with your excel and your date format
CHART
sum({<[Order Date]={"$(=date(max([Order Date])-1,'MM/DD/YYYY'))"}>} Sales)
sum({<[Order Date]={">=$(=date(max([Order Date])-1,'MM/DD/YYYY'))"}>} Sales)
SCRIPT
SET DateFormat='MM/DD/YYYY';
SET TimestampFormat='MM/DD/YYYY hh:mm:ss[.fff]';
Directory;
LOAD [Row ID],
[Order ID],
[Order Date],
[Ship Date],
[Ship Mode],
[Customer ID],
[Customer Name],
Segment,
[Postal Code],
City,
State,
Country,
Region,
Market,
[Product ID],
Category,
[Sub-Category],
[Product Name],
Sales,
Quantity,
Discount,
Profit,
[Shipping Cost],
[Order Priority]
FROM
[Global Superstore Orders 2016.xlsx]
(ooxml, embedded labels, table is Orders);
- Mark as New
- Bookmark
- Subscribe
- Mute
- Subscribe to RSS Feed
- Permalink
- Report Inappropriate Content
Hi,
I am using the below fields:
Sales:- for expression
Order Date:- for dimension.
The fields which I have mentioned earlier are demo purposes.
So try with above two fields as of now and create same day sales, previous day sales, current week sales,previous week sales, current month and previous month and 9 rolling periods sales columns as expression.
Thanks,
Sandip
- Mark as New
- Bookmark
- Subscribe
- Mute
- Subscribe to RSS Feed
- Permalink
- Report Inappropriate Content
Hi,
Thanks for your reply. But have you tried with your set analysis in the chart(Straight Table😞
sum({<[Order Date]={"$(=date(max([Order Date])-1,'MM/DD/YYYY'))"}>} Sales)
sum({<[Order Date]={">=$(=date(max([Order Date])-1,'MM/DD/YYYY'))"}>} Sales)
I just saw that you have just hard coded the date value and I had also tried the same way, but I saw that when I hard coded the value, it works, but when I just put the filed name it is not working.
So just put the field names in the expression.
Thanks,
Sandip
- Mark as New
- Bookmark
- Subscribe
- Mute
- Subscribe to RSS Feed
- Permalink
- Report Inappropriate Content
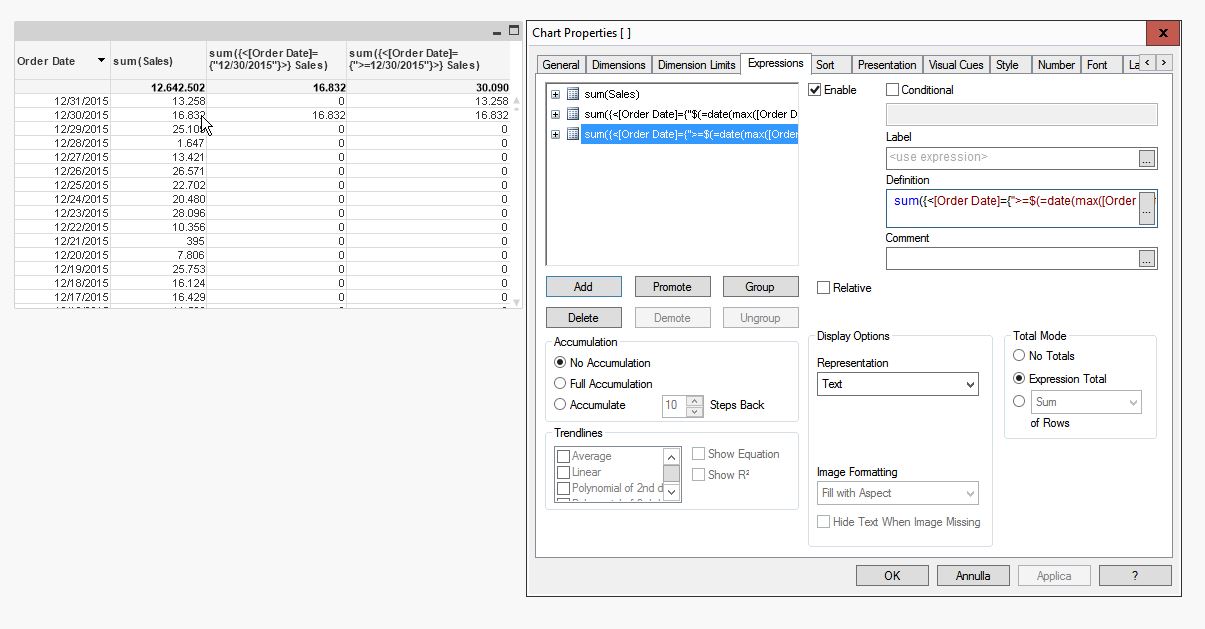
The date is not hard coded.
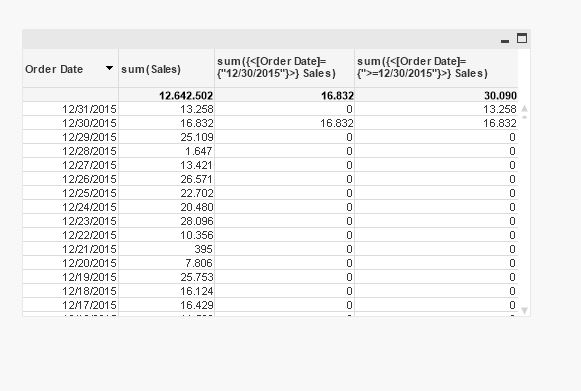
I left the chart label blank to check the expression, the chart expressions (not hard coded) are
sum({<[Order Date]={"$(=date(max([Order Date])-1,'MM/DD/YYYY'))"}>} Sales)
sum({<[Order Date]={">=$(=date(max([Order Date])-1,'MM/DD/YYYY'))"}>} Sales)
You can see that in the image or in the attachment
- Mark as New
- Bookmark
- Subscribe
- Mute
- Subscribe to RSS Feed
- Permalink
- Report Inappropriate Content
I can see in your attached image that only values are showing for maximum date 31/12/2015, but not for the other date. So this is not what I am expecting and I expect that for each row there is an Order Date and for each Order Date's current sale and previous Date's sales will show at row level like this:
- Mark as New
- Bookmark
- Subscribe
- Mute
- Subscribe to RSS Feed
- Permalink
- Report Inappropriate Content
Maybe with the above function, something like above (sum(Sales)) to get the previous row value, but it seems from the dimension label (AsOfOrder) you have an AsOf; it would be better if you can post a small example (.qvw)
- Mark as New
- Bookmark
- Subscribe
- Mute
- Subscribe to RSS Feed
- Permalink
- Report Inappropriate Content
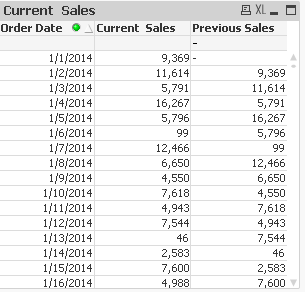
Dimension is [Order Date]
Current Sales Column Expression ---sum({<[Order Date]={'>=$(vPreviousDate)'}>}Sales)
Previous Sales Column Expression---Above([Current Sales])
vPreviousDate=Date(Max([Order Date])-1)
- Mark as New
- Bookmark
- Subscribe
- Mute
- Subscribe to RSS Feed
- Permalink
- Report Inappropriate Content
Hi,
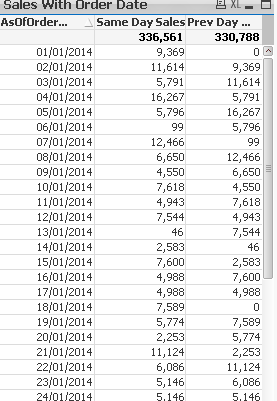
I am using your code with little bit modified and have attached the demo QVW. But I am getting the wrong result as shown below:
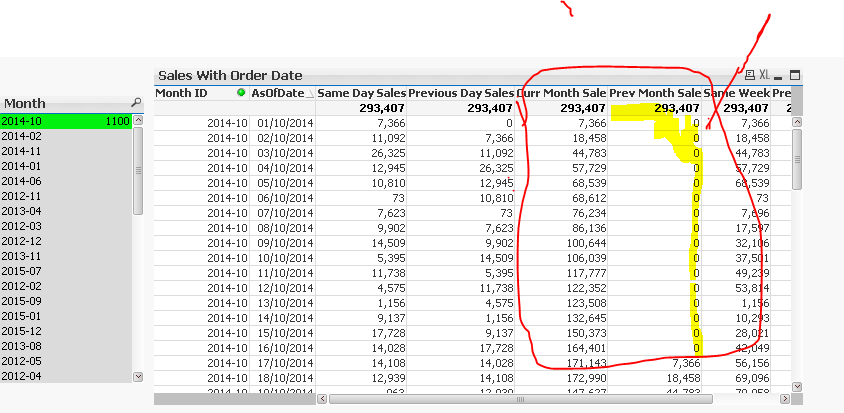
So whenever I add AsOfDate', 'MonthID as dimensions and add the following expressions it gives me wrong results:
1. sum({<FlagDate={'Current Day'}>}Sales) - for current date
2. sum({<FlagDate={'Previous Day'}>}Sales) - for previous day date
3. sum({<FlagMonth={'Current Month'}>}Sales) - for current month
4. sum({<FlagMonth={'Previous Month'}>}Sales) - for previous month
5. sum({<WeekDiff={0}>}Sales) - for current week
6. sum({<WeekDiff={1}>}Sales) - for previous week
So in my chart with title: 'Sales With Order Date' gives me wrong result for current month and previous month, as because they show the 0 values there.
So please help me to modify my script or chart expression !to overcome this problem.
- Mark as New
- Bookmark
- Subscribe
- Mute
- Subscribe to RSS Feed
- Permalink
- Report Inappropriate Content
Hi,
what is : Above([Current Sales])? here?
means [Current Sales] is not understandable to me.
Also see the below screenshot at when I did not select any order date:
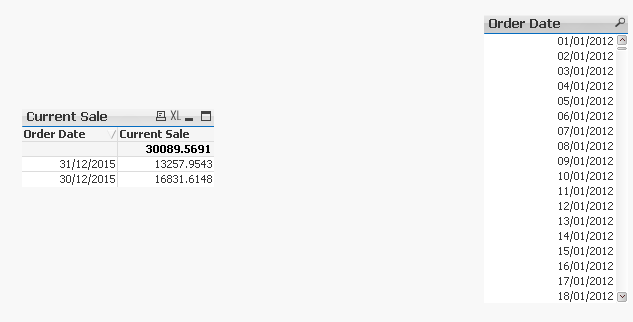
But when I select any date it is showing the result after that date. So I am expecting it will show data for all the dates without selecting any date from list box.
Thanks,
Sandip
- Mark as New
- Bookmark
- Subscribe
- Mute
- Subscribe to RSS Feed
- Permalink
- Report Inappropriate Content
... is the respective row above the expression current sales...