Unlock a world of possibilities! Login now and discover the exclusive benefits awaiting you.
- Qlik Community
- :
- All Forums
- :
- QlikView App Dev
- :
- Re: take previous month data in pivot
- Subscribe to RSS Feed
- Mark Topic as New
- Mark Topic as Read
- Float this Topic for Current User
- Bookmark
- Subscribe
- Mute
- Printer Friendly Page
- Mark as New
- Bookmark
- Subscribe
- Mute
- Subscribe to RSS Feed
- Permalink
- Report Inappropriate Content
take previous month data in pivot
Hi All,
When there is no data available in the current month, i want to bring from previous month in the pivot table (attached file)
Product B- High has no data in Feb. So take 86.20% from previous month.
Product C- Low has no data in the May. So take 100% from previous month.
I want to do this in this chart locally, is it possible?
- Mark as New
- Bookmark
- Subscribe
- Mute
- Subscribe to RSS Feed
- Permalink
- Report Inappropriate Content
Check out the attached
- Mark as New
- Bookmark
- Subscribe
- Mute
- Subscribe to RSS Feed
- Permalink
- Report Inappropriate Content
Thanks you so much Sunny 
See how there is no Feb for Product = B and Status = High... you will need to make sure that the MonthYear Feb Exits for this combination... may be with the Sales 0 and Margin 0
Just a final query. May i know what Rangesum is doing here. Why atleast sales 0 or margin 0 is required (as you mentioned in the comment).
Avg(aggr(If(RangeSum(sum(Margin)/sum(Sales), 0.1) = 0.1, Above(sum(Margin)/sum(Sales)), sum(Margin)/sum(Sales)), Product,Status,MonthYear))
- Mark as New
- Bookmark
- Subscribe
- Mute
- Subscribe to RSS Feed
- Permalink
- Report Inappropriate Content
Hi Sunny,
The expression is taking previous month data only till next month, not to the further months.
Avg(aggr(If(RangeSum(sum(Margin)/sum(Sales), 0.1) = 0.1, Above(sum(Margin)/sum(Sales)), sum(Margin)/sum(Sales)), Product,Status,MonthYear))
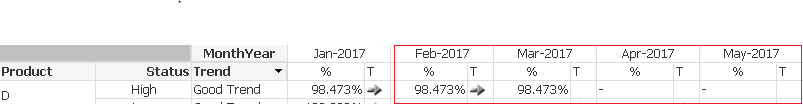
Product D- High has no data for Mar, Apr, May. The data is carried only till next month(ie. from Feb to Mar), not to the further months.
Please suggest.
- Mark as New
- Bookmark
- Subscribe
- Mute
- Subscribe to RSS Feed
- Permalink
- Report Inappropriate Content
This unfortunately may not work with your requirement to get the Average for the total row.... if you need the total and also the carrying forward, you will need to do this in the script
- Mark as New
- Bookmark
- Subscribe
- Mute
- Subscribe to RSS Feed
- Permalink
- Report Inappropriate Content
Hi Sunny,
ok, I am fine without the total row.
I using your first solution and notice the same issue in % and T columns
If(Len(Trim(sum(Margin)/sum(Sales))) = 0, Before(sum(Margin)/sum(Sales)), sum(Margin)/sum(Sales))
- Mark as New
- Bookmark
- Subscribe
- Mute
- Subscribe to RSS Feed
- Permalink
- Report Inappropriate Content
Not worrying about the Average, you can use this
If(RangeSum(sum(Margin)/sum(Sales), 0.1) = 0.1, Before([%]), sum(Margin)/sum(Sales))
Where [%] is your column name within the square brackets
- Mark as New
- Bookmark
- Subscribe
- Mute
- Subscribe to RSS Feed
- Permalink
- Report Inappropriate Content
Thanks Sunny
The T column (arrows) seems not working, how can i adjust it.
Could you suggest, what is rangesum with = 0.1 condition in your expression.
- Mark as New
- Bookmark
- Subscribe
- Mute
- Subscribe to RSS Feed
- Permalink
- Report Inappropriate Content
Check attached
- Mark as New
- Bookmark
- Subscribe
- Mute
- Subscribe to RSS Feed
- Permalink
- Report Inappropriate Content
Thank you so much again..
Final query. Because i cannot have total in the chart. I want to have it in a text objects(for each month) under the chart.
Could you let me know how the aggr expression showing average for a month column, please.
- Mark as New
- Bookmark
- Subscribe
- Mute
- Subscribe to RSS Feed
- Permalink
- Report Inappropriate Content
Aggr() isn't going to work because we your using column labels... unfortunately the only way to do this would be to do it in the script or an even more complex expression.
Please consider marking correct and helpful response once you get what you were looking for...