Unlock a world of possibilities! Login now and discover the exclusive benefits awaiting you.
- Qlik Community
- :
- All Forums
- :
- QlikView App Dev
- :
- Re: top 5 records in bar chart(2dims and 2 express...
- Subscribe to RSS Feed
- Mark Topic as New
- Mark Topic as Read
- Float this Topic for Current User
- Bookmark
- Subscribe
- Mute
- Printer Friendly Page
- Mark as New
- Bookmark
- Subscribe
- Mute
- Subscribe to RSS Feed
- Permalink
- Report Inappropriate Content
top 5 records in bar chart(2dims and 2 expressions)
hi , source data:
| Year | Loc | Sales | Target |
| 2015 | a | 100 | 200 |
| 2015 | b | 250 | 150 |
| 2015 | c | 50 | 100 |
| 2016 | a | 250 | 200 |
| 2016 | b | 200 | 20 |
| 2016 | c | 350 | 200 |
| 2016 | d | 10 | 5 |
| 2017 | a | 300 | 200 |
| 2017 | b | 100 | 300 |
| 2017 | c | 400 | 200 |
need output like below(need to display output in stright table and bar chart):
| Year | Loc | Sales | Target |
| 2017 | c | 400 | 200 |
| 2017 | a | 300 | 200 |
| 2016 | c | 350 | 200 |
| 2016 | a | 250 | 200 |
| 2015 | b | 250 | 150 |
Requirement: top 5 records based on sum(Sales) and year descending order.
dimensions: Year,Loc
Expression : sum(sales),sum(target)
- Mark as New
- Bookmark
- Subscribe
- Mute
- Subscribe to RSS Feed
- Permalink
- Report Inappropriate Content
Hi,
LOAD * Inline
[
Year,Loc,Sales,Target
2015,a,100,200
2015,b,250,150
2015,c,50,100
2016,a,250,200
2016,b,200,20
2016,c,350,200
2016,d,10,5
2017,a,300,200
2017,b,100,300
2017,c,400,200
]
;
Dimension: Year, Loc
Expression :
for Sales =Sum({<Sales={"= Rank(Sum(Sales))<5"}>} Sales)
for Target = =Sum({<Sales={"= Rank(Sum(Sales))<5"}>} Target)
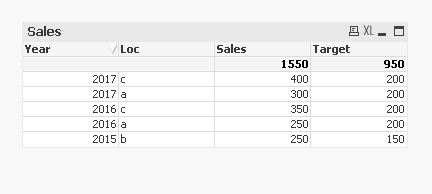
Output:
Thanks,
Mukram.
- Mark as New
- Bookmark
- Subscribe
- Mute
- Subscribe to RSS Feed
- Permalink
- Report Inappropriate Content
Thanks for response, same is working in table but not in chart,can you please check .
- Mark as New
- Bookmark
- Subscribe
- Mute
- Subscribe to RSS Feed
- Permalink
- Report Inappropriate Content
Instead of two dimensions in your bar chart, use one calculated dimension
= Year & ' - ' & Loc
- Mark as New
- Bookmark
- Subscribe
- Mute
- Subscribe to RSS Feed
- Permalink
- Report Inappropriate Content
As per requirement,I have to use 2 separate dims.
- Mark as New
- Bookmark
- Subscribe
- Mute
- Subscribe to RSS Feed
- Permalink
- Report Inappropriate Content
Hi Team, any other possibilities?
- Mark as New
- Bookmark
- Subscribe
- Mute
- Subscribe to RSS Feed
- Permalink
- Report Inappropriate Content
Hi Stefen, any other possibilities ?
- Mark as New
- Bookmark
- Subscribe
- Mute
- Subscribe to RSS Feed
- Permalink
- Report Inappropriate Content
Hi Ali,any other possibilities by using 2 separate dims?
- Mark as New
- Bookmark
- Subscribe
- Mute
- Subscribe to RSS Feed
- Permalink
- Report Inappropriate Content
Hi All,
I have similar situation with two dimensions in a stacked bar chart.
Requirement is to calculate the top 10 sales for products for each year.
Can anybody help.
Thanks in advance.