Unlock a world of possibilities! Login now and discover the exclusive benefits awaiting you.
- Qlik Community
- :
- All Forums
- :
- QlikView App Dev
- :
- total line to show total of count distincts in row...
- Subscribe to RSS Feed
- Mark Topic as New
- Mark Topic as Read
- Float this Topic for Current User
- Bookmark
- Subscribe
- Mute
- Printer Friendly Page
- Mark as New
- Bookmark
- Subscribe
- Mute
- Subscribe to RSS Feed
- Permalink
- Report Inappropriate Content
total line to show total of count distincts in rows
Data:
Territory | TransDate | |
A | 20150101 | |
A | 20150102 | |
A | 20150102 | |
B | 20150101 | |
B | 20150102 | |
B | 20150102 | |
B | 20150103 |
Report:
Territory | Unique days |
A | 2 |
B | 3 |
Total | 3 (this is where i want '5' to be reported) |
The column Unique days is defined as count(distinct [TransDate]).
The report total line reports ‘3’, which is understandable, however what I want is for the total line to report ‘5’ (the total of the territory’s unique days)
Any ideas?
thanks
- Mark as New
- Bookmark
- Subscribe
- Mute
- Subscribe to RSS Feed
- Permalink
- Report Inappropriate Content
Try this as your expression:
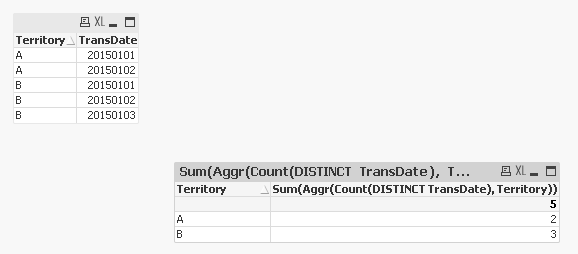
Sum(Aggr(Count(DISTINCT TransDate), Territory))
- Mark as New
- Bookmark
- Subscribe
- Mute
- Subscribe to RSS Feed
- Permalink
- Report Inappropriate Content
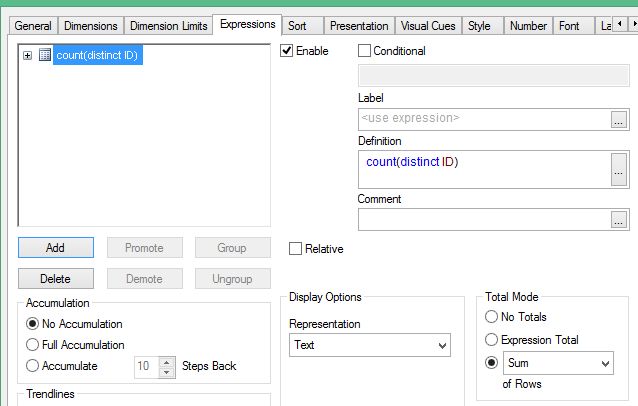
In expression tab,there is an option called Total Mode, you can select the option Sum of Rows
- Mark as New
- Bookmark
- Subscribe
- Mute
- Subscribe to RSS Feed
- Permalink
- Report Inappropriate Content
Thanks Sunny, unfortunately, that still gives distinct counts of dates, but at Territory level.
- Mark as New
- Bookmark
- Subscribe
- Mute
- Subscribe to RSS Feed
- Permalink
- Report Inappropriate Content
Good advice, If I were you, I would do it this way.
- Mark as New
- Bookmark
- Subscribe
- Mute
- Subscribe to RSS Feed
- Permalink
- Report Inappropriate Content
Hi,
if you need this in a chart - would total mode "sum" meet your needs?
It's on the Expressions-Tab:
Regards,
Tobias
- Mark as New
- Bookmark
- Subscribe
- Mute
- Subscribe to RSS Feed
- Permalink
- Report Inappropriate Content
Hi,thanks for the suggestion, for this expression, "total Mode" is disabled (grayed out), with "Expression Total" selected. I switched to Straight Table, changed the Total mode as suggested, switched back to Pivot table, and the result is the same, still shows a count distinct in the total row.
- Mark as New
- Bookmark
- Subscribe
- Mute
- Subscribe to RSS Feed
- Permalink
- Report Inappropriate Content
For the pivot table you would have to use the Aggr expression I provided:
Sum(Aggr(Count(DISTINCT TransDate), Territory))