Unlock a world of possibilities! Login now and discover the exclusive benefits awaiting you.
- Qlik Community
- :
- All Forums
- :
- QlikView App Dev
- :
- Re: total of three charts on the top in text box
- Subscribe to RSS Feed
- Mark Topic as New
- Mark Topic as Read
- Float this Topic for Current User
- Bookmark
- Subscribe
- Mute
- Printer Friendly Page
- Mark as New
- Bookmark
- Subscribe
- Mute
- Subscribe to RSS Feed
- Permalink
- Report Inappropriate Content
total of three charts on the top in text box
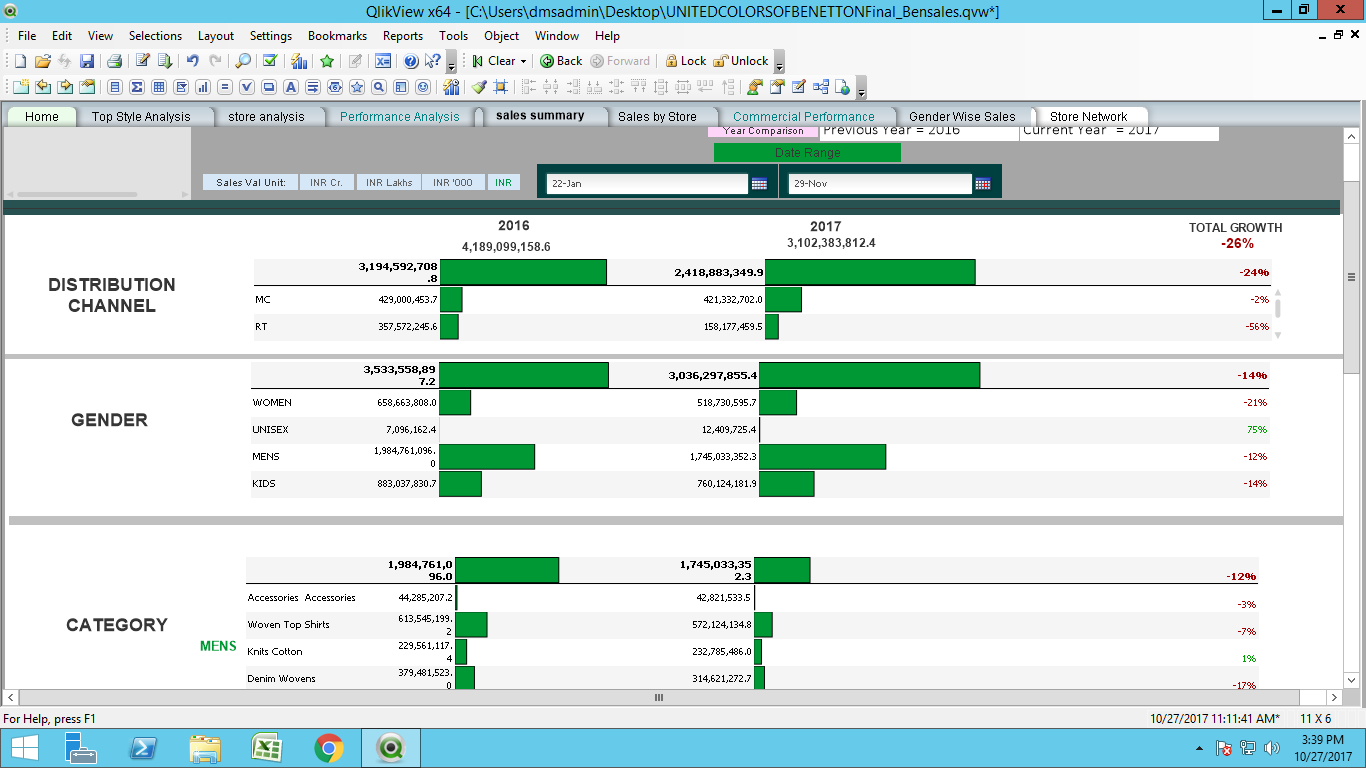
I want total of distribution channel + gender + category in a text box ie total of (total growth)12+ 14 + 24( as seen in image)
and also total of individual expression ie 2016 and 2017
- « Previous Replies
- Next Replies »
- Mark as New
- Bookmark
- Subscribe
- Mute
- Subscribe to RSS Feed
- Permalink
- Report Inappropriate Content
Simply rite
count(channel )+count( gender )+ count(category ) //change according to your field names
//year 2016
count({<Year={2016}>}channel )+count( {<Year={2016}>}gender )+ count({<Year={2016}>}category )
- Mark as New
- Bookmark
- Subscribe
- Mute
- Subscribe to RSS Feed
- Permalink
- Report Inappropriate Content
Perhaps these?
1) Sum(TOTAL <FieldName> [GROWTH Expression])
2) Sum({<Year = {'$(=AddYears(Max(Year),-1))'}>} TOTAL <FieldName> Measure)
3) Sum({<Year = {'$(=Max(Year))'}>} TOTAL <FieldName> Measure)
- Mark as New
- Bookmark
- Subscribe
- Mute
- Subscribe to RSS Feed
- Permalink
- Report Inappropriate Content
=num(
if(vSelectTab2 = 'Sales View',
sum(if(Sold_Date <= MakeDate(2014,month(To),day(To)) and Sold_Date >= MakeDate(2014,month(From),day(From)), [inv value]))/Sales_INR_Unit
,
sum(if(Sold_Date <= MakeDate(2014,month(To),day(To)) and Sold_Date >= MakeDate(2014,month(From),day(From)) and [Season Code] = $(vSales_Summary_Previous_Season), [inv value]))/Sales_INR_Unit)
,
'#,##0.0')
you mean this?
- Mark as New
- Bookmark
- Subscribe
- Mute
- Subscribe to RSS Feed
- Permalink
- Report Inappropriate Content
This expression is giving an erro
- Mark as New
- Bookmark
- Subscribe
- Mute
- Subscribe to RSS Feed
- Permalink
- Report Inappropriate Content
Will you able to provide application?
- Mark as New
- Bookmark
- Subscribe
- Mute
- Subscribe to RSS Feed
- Permalink
- Report Inappropriate Content
What is your TOTAL GROWTH expression in the charts?
- Mark as New
- Bookmark
- Subscribe
- Mute
- Subscribe to RSS Feed
- Permalink
- Report Inappropriate Content
=num(
if(vSelectTab2 = 'Sales View',
sum(if(Sold_Date <= MakeDate(2015,month(To),day(To)) and Sold_Date >= MakeDate(2015,month(From),day(From)), [inv value]))/10000000
,
sum(if(Sold_Date <= MakeDate(2015,month(To),day(To)) and Sold_Date >= MakeDate(2015,month(From),day(From)) and [Season Code] = $(vSales_Summary_Current_Season), [inv value]))/10000000)
/
if(vSelectTab2 = 'Sales View',
sum(if(Sold_Date <= MakeDate(2014,month(To),day(To)) and Sold_Date >= MakeDate(2014,month(From),day(From)), [inv value]))/10000000
,
sum(if(Sold_Date <= MakeDate(2014,month(To),day(To)) and Sold_Date >= MakeDate(2014,month(From),day(From)) and [Season Code] = $(vSales_Summary_Previous_Season), [inv value]))/10000000)
-1
,'#,##0%')
- Mark as New
- Bookmark
- Subscribe
- Mute
- Subscribe to RSS Feed
- Permalink
- Report Inappropriate Content
Do you have the same expression in the three chart with different dimensions? Can you share the dimension from the charts also
- Mark as New
- Bookmark
- Subscribe
- Mute
- Subscribe to RSS Feed
- Permalink
- Report Inappropriate Content
for distribution channel for sales view
=num(
(sum(if(Sold_Date <= MakeDate(Curr_Year,month(To),day(To)) and Sold_Date >= MakeDate(Curr_Year,month(From),day(From)), [inv value]))
-
sum(if(Sold_Date <= MakeDate(Prev_Year,month(To),day(To)) and Sold_Date >= MakeDate(Prev_Year,month(From),day(From)), [inv value])))
/
sum(if(Sold_Date <= MakeDate(Prev_Year,month(To),day(To)) and Sold_Date >= MakeDate(Prev_Year,month(From),day(From)), [inv value])),
'#,##0%')
for distribution channel for season view
=num(
(sum(if(Sold_Date <= MakeDate(Curr_Year,month(To),day(To)) and Sold_Date >= MakeDate(Curr_Year,month(From),day(From)) and [Season Code] = $(vSales_Summary_Current_Season), [inv value]))
-
sum(if(Sold_Date <= MakeDate(Prev_Year,month(To),day(To)) and Sold_Date >= MakeDate(Prev_Year,month(From),day(From)) and [Season Code] = $(vSales_Summary_Previous_Season), [inv value])))
/
sum(if(Sold_Date <= MakeDate(Prev_Year,month(To),day(To)) and Sold_Date >= MakeDate(Prev_Year,month(From),day(From)) and [Season Code] = $(vSales_Summary_Previous_Season), [inv value])),
'#,##0%')
for gender for sales view
=num(
(sum(if(Sold_Date <= MakeDate(Curr_Year,month(To),day(To)) and Sold_Date >= MakeDate(Curr_Year,month(From),day(From)), [inv value]))
-
sum(if(Sold_Date <= MakeDate(Prev_Year,month(To),day(To)) and Sold_Date >= MakeDate(Prev_Year,month(From),day(From)), [inv value])))
/
sum(if(Sold_Date <= MakeDate(Prev_Year,month(To),day(To)) and Sold_Date >= MakeDate(Prev_Year,month(From),day(From)), [inv value])),
'#,##0%')
and same for other charts too
- « Previous Replies
- Next Replies »