Unlock a world of possibilities! Login now and discover the exclusive benefits awaiting you.
- Qlik Community
- :
- All Forums
- :
- QlikView App Dev
- :
- Re: two fields in two diagramms on one page
- Subscribe to RSS Feed
- Mark Topic as New
- Mark Topic as Read
- Float this Topic for Current User
- Bookmark
- Subscribe
- Mute
- Printer Friendly Page
- Mark as New
- Bookmark
- Subscribe
- Mute
- Subscribe to RSS Feed
- Permalink
- Report Inappropriate Content
two fields in two diagramms on one page
hey there,
it is very easy to get a diagram with one field...
i tried to combine two fields with a "&" but the solution is that both fields are in one diagram... but i want to have two fields in two diagram on one page. - i it possible?
Because i want to compare two different fields.
Can somebody help me? thanks a lot!
- « Previous Replies
-
- 1
- 2
- Next Replies »
Accepted Solutions
- Mark as New
- Bookmark
- Subscribe
- Mute
- Subscribe to RSS Feed
- Permalink
- Report Inappropriate Content
Why don't you try what I suggested above:
=Subfield( Concat(DISTINCT FieldName,'|'),'|',1)
resp.
=Subfield( Concat(DISTINCT FieldName,'|'),'|',2)
- Mark as New
- Bookmark
- Subscribe
- Mute
- Subscribe to RSS Feed
- Permalink
- Report Inappropriate Content
Sure, you can create two diagrams, each filtered by the appropriate field's value. Or maybe use a trellis chart (on dimension tab).
Two help you more, please post more details about your two fields, best by posting a small sample QVW.
- Mark as New
- Bookmark
- Subscribe
- Mute
- Subscribe to RSS Feed
- Permalink
- Report Inappropriate Content
Hi RG,
of course you can!
Andy
- Mark as New
- Bookmark
- Subscribe
- Mute
- Subscribe to RSS Feed
- Permalink
- Report Inappropriate Content
okay, its a little bit more difficult.
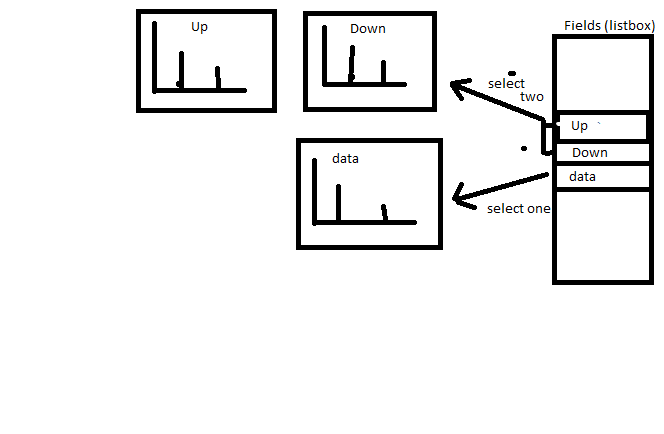
In my project are many fields, and i have one diagram. You can select the different fields in a listbox. But you can only take one field, that is presented in the diagram. the diagram has two dimensions (the time as first and one field by selection in a listbox as second).
Now my question: is it possible when i select two fields, that it show me two diagram.
- Mark as New
- Bookmark
- Subscribe
- Mute
- Subscribe to RSS Feed
- Permalink
- Report Inappropriate Content
Would be easier to help if you could post a small sample QVW.
In general, you can use GetSelectedCount( FieldName ) to check if you have more than one value selected.
If so, you can enable a second chart using the show condition on layout tab of the chart.
=GetSelectedCount( FieldName ) = 2
- Mark as New
- Bookmark
- Subscribe
- Mute
- Subscribe to RSS Feed
- Permalink
- Report Inappropriate Content
thanks for your answer.
this should be a solution. i thought to do it on a similar way... but i dont know how. i am very new to this program.
1.) and there is a problem: when i select two fields, how can i set the different fields to the diagrams? i can click on both, but how can i differ between of both selections?
2.) I think to do it with a multibox. But when only one diagram is activated, there is a big empty place... is there any way to change the columne and row of a multibox depend on the GetSelectedCount( FieldName ) ?!?
- Mark as New
- Bookmark
- Subscribe
- Mute
- Subscribe to RSS Feed
- Permalink
- Report Inappropriate Content
You can address the two selected values like
=Subfield( Concat(DISTINCT FieldName,'|'),'|',1)
resp.
=Subfield( Concat(DISTINCT FieldName,'|'),'|',2)
- Mark as New
- Bookmark
- Subscribe
- Mute
- Subscribe to RSS Feed
- Permalink
- Report Inappropriate Content
hey,
thank you. but i dont understand what your code is doing and where i have to put it.
maybe you can help me with this:
1.) i am using getfieldselections(Fieldname) and i want with set analyses only the field with "up" inside... i dont know the syntax. i tried, but it's always wrong...
btw: getfieldselections(Fieldname) returns "text up" and "text down"
i tried something like this:
{$<fieldname={"*up"}>}getfieldselections(fieldname)
2.) i not want to change the multibox! i want to change the container rows or/and column by selecting one or two fields. is it possible?
- Mark as New
- Bookmark
- Subscribe
- Mute
- Subscribe to RSS Feed
- Permalink
- Report Inappropriate Content
Please post a small sample QVW, this makes it much easier to help you.
- Mark as New
- Bookmark
- Subscribe
- Mute
- Subscribe to RSS Feed
- Permalink
- Report Inappropriate Content
it doesnt work with =Subfield( Concat(DISTINCT FieldName,'|'),'|',1) - there is a "dynamic error" ( i put it into the dynamic dimension...)
okay, i try to make a little qvw file. but it would be next week...
thanks you...
- « Previous Replies
-
- 1
- 2
- Next Replies »