Unlock a world of possibilities! Login now and discover the exclusive benefits awaiting you.
- Qlik Community
- :
- All Forums
- :
- QlikView App Dev
- :
- Re: unique values into another table
- Subscribe to RSS Feed
- Mark Topic as New
- Mark Topic as Read
- Float this Topic for Current User
- Bookmark
- Subscribe
- Mute
- Printer Friendly Page
- Mark as New
- Bookmark
- Subscribe
- Mute
- Subscribe to RSS Feed
- Permalink
- Report Inappropriate Content
unique values into another table
Hi everyone,
I'm new to qlikview and I'm struggling with a relatively easy problem.
I have the following chunk of my table.
| RowNo | X | Y |
|---|---|---|
| 1 | 11 | 12 |
| 2 | 11 | 12 |
| 3 | 22 | 8 |
| 4 | 22 | 8 |
| 5 | 22 | 8 |
| 6 | 33 | 4 |
| 7 | 22 | 8 |
| 8 | 22 | 8 |
| 9 | 11 | 12 |
| 10 | 11 | 12 |
| 11 | 55 | 2 |
I have to do 2 things here:
1- I would like extract from this table, the unique values and get the following table:
| X | Y |
|---|---|
| 11 | 12 |
| 22 | 8 |
| 33 | 4 |
| 55 | 2 |
How can I do this? I tried to use distinct, but it is not giving me what I want
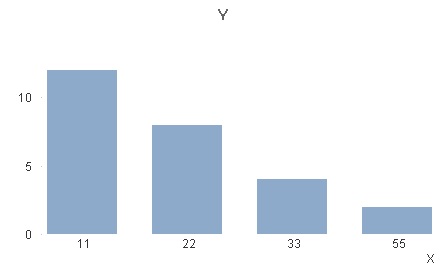
2- From the new table, I want to create a simple histogram. I guess I should use X as dimension and Y as expression right?
I think I still miss the idea of how qlikview treats dimensions and expressions, can someone guide me to a documentation where this is well explained. Thank you
- « Previous Replies
-
- 1
- 2
- Next Replies »
Accepted Solutions
- Mark as New
- Bookmark
- Subscribe
- Mute
- Subscribe to RSS Feed
- Permalink
- Report Inappropriate Content
Straight table:
Dim1:X
Dim2:Y // you might or might not need this
Exp1: Count(X)
- Mark as New
- Bookmark
- Subscribe
- Mute
- Subscribe to RSS Feed
- Permalink
- Report Inappropriate Content
- Mark as New
- Bookmark
- Subscribe
- Mute
- Subscribe to RSS Feed
- Permalink
- Report Inappropriate Content
Try a chart (straight table for tabular presentation, Bar chart- for histogram) with below setting:
Dimension: X
Expression: Sum( Distinct Y)
- Mark as New
- Bookmark
- Subscribe
- Mute
- Subscribe to RSS Feed
- Permalink
- Report Inappropriate Content
Try this,
X as DImension,
Y as Expression
Aggr(Sum(Y), RowNo)
- Mark as New
- Bookmark
- Subscribe
- Mute
- Subscribe to RSS Feed
- Permalink
- Report Inappropriate Content
Refer the attached file. hope this will help you.
- Mark as New
- Bookmark
- Subscribe
- Mute
- Subscribe to RSS Feed
- Permalink
- Report Inappropriate Content
The first question, is how can I get from table one to table two? If I remove RowNo from the dimension, I dont get any data.
and why there is sum here? I don't want to sum anything.
- Mark as New
- Bookmark
- Subscribe
- Mute
- Subscribe to RSS Feed
- Permalink
- Report Inappropriate Content
Have you checked my attachment?
I've created that table.
- Mark as New
- Bookmark
- Subscribe
- Mute
- Subscribe to RSS Feed
- Permalink
- Report Inappropriate Content
Have you tried using a table box ? Use only the dimensions X and Y. That should get you the first requirement done. For 2nd try using my suggestion above.
- Mark as New
- Bookmark
- Subscribe
- Mute
- Subscribe to RSS Feed
- Permalink
- Report Inappropriate Content
Table box only shows Unique records only,
If you take X and Y, that should be unique records.
| X | Y |
|---|---|
| 11 | 12 |
| 22 | 8 |
| 33 | 4 |
| 55 | 2 |
- Mark as New
- Bookmark
- Subscribe
- Mute
- Subscribe to RSS Feed
- Permalink
- Report Inappropriate Content
Hi Abdullah,
If you want to create your table of distinct values in your data model then:
RawData:
LOAD X,
Y
FROM
[https://community.qlik.com/thread/269310]
(html, codepage is 1252, embedded labels, table is @1);
NoConcatenate
DistinctData:
LOAD
Distinct X,Y Resident RawData;
DROP Table RawData;
For your bar chart dimension X and expression Y will be fine. If you don't specify an aggregation function QlikView assumes Only(Y) which returns Y if there is only one value for Y and is null if more than one. Since for each value of X there is a single value of Y no explicit aggregation is required.

Regards
Andrew
- « Previous Replies
-
- 1
- 2
- Next Replies »