Unlock a world of possibilities! Login now and discover the exclusive benefits awaiting you.
- Qlik Community
- :
- All Forums
- :
- QlikView App Dev
- :
- Re: value in one column equals to value 1 row afte...
- Subscribe to RSS Feed
- Mark Topic as New
- Mark Topic as Read
- Float this Topic for Current User
- Bookmark
- Subscribe
- Mute
- Printer Friendly Page
- Mark as New
- Bookmark
- Subscribe
- Mute
- Subscribe to RSS Feed
- Permalink
- Report Inappropriate Content
value in one column equals to value 1 row after in another column
Hi, how can I have column B take the value of the day after?:
| Date | A | B |
|---|---|---|
| 1-Jun | 14 | 10 |
| 2-Jun | 10 | 7 |
| 3-Jun | 7 | 35 |
| 4-Jun | 35 | 24 |
| 5-Jun | 24 | 32 |
| 6-Jun | 32 |
Thanks.
- Mark as New
- Bookmark
- Subscribe
- Mute
- Subscribe to RSS Feed
- Permalink
- Report Inappropriate Content
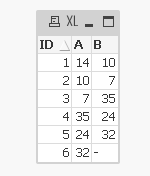
Use the following script to get the data in the table box shown below:
Table1:
LOAD RowNo() as ID, * Inline [
A
14
10
7
35
24
32
];
Table2:
LOAD ID, A, Peek(A) as B
Resident Table1 Order By ID desc;
- Mark as New
- Bookmark
- Subscribe
- Mute
- Subscribe to RSS Feed
- Permalink
- Report Inappropriate Content
Table1:
LOAD * Inline [
A
14
10
7
35
24
32
];
Table2:
LOAD A,Peek(A,RecNo(),'Table1') as B
Resident Table1 ;
- Mark as New
- Bookmark
- Subscribe
- Mute
- Subscribe to RSS Feed
- Permalink
- Report Inappropriate Content
Hi,
Check the attached app if you want to handle it from the expression level.
Regrads,
Ravikumar
- Mark as New
- Bookmark
- Subscribe
- Mute
- Subscribe to RSS Feed
- Permalink
- Report Inappropriate Content
Use Below() function. Hope you will get your desire result.
- Mark as New
- Bookmark
- Subscribe
- Mute
- Subscribe to RSS Feed
- Permalink
- Report Inappropriate Content
Hi, so sorry can you screenshot? I can only open files that I create myself. Thanks.
- Mark as New
- Bookmark
- Subscribe
- Mute
- Subscribe to RSS Feed
- Permalink
- Report Inappropriate Content
source:
LOAD Date, A, B
FROM [http://community.qlik.com/thread/134649] (html, codepage is 1252, embedded labels, table is @1);
final:
noconcatenate
load Date, A,
peek(A) as B
Resident
source
order by Date desc;
drop table source;
- Mark as New
- Bookmark
- Subscribe
- Mute
- Subscribe to RSS Feed
- Permalink
- Report Inappropriate Content
Hi,
Create the chart like this
Straight Table:
Dim : Date
Exp1: Sum(A) (Column Label A)
Exp2: Below(A) (Column Label B)
Here is the screen shot of the chart in the attached SampleApp of my earlier post.
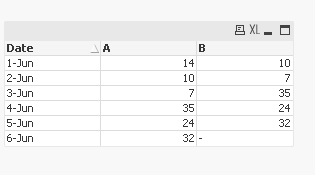
Regards,
Ravikumar
- Mark as New
- Bookmark
- Subscribe
- Mute
- Subscribe to RSS Feed
- Permalink
- Report Inappropriate Content
tabInput:
LOAD Date, A
FROM [http://community.qlik.com/thread/134649] (html, codepage is 1252, embedded labels, table is @1);
Left Join
LOAD Date,
Previous(A) as B
Resident tabInput
Order By Date desc;