Unlock a world of possibilities! Login now and discover the exclusive benefits awaiting you.
- Qlik Community
- :
- All Forums
- :
- QlikView App Dev
- :
- Re: wrong total sums in chart
- Subscribe to RSS Feed
- Mark Topic as New
- Mark Topic as Read
- Float this Topic for Current User
- Bookmark
- Subscribe
- Mute
- Printer Friendly Page
- Mark as New
- Bookmark
- Subscribe
- Mute
- Subscribe to RSS Feed
- Permalink
- Report Inappropriate Content
wrong total sums in chart
hi,
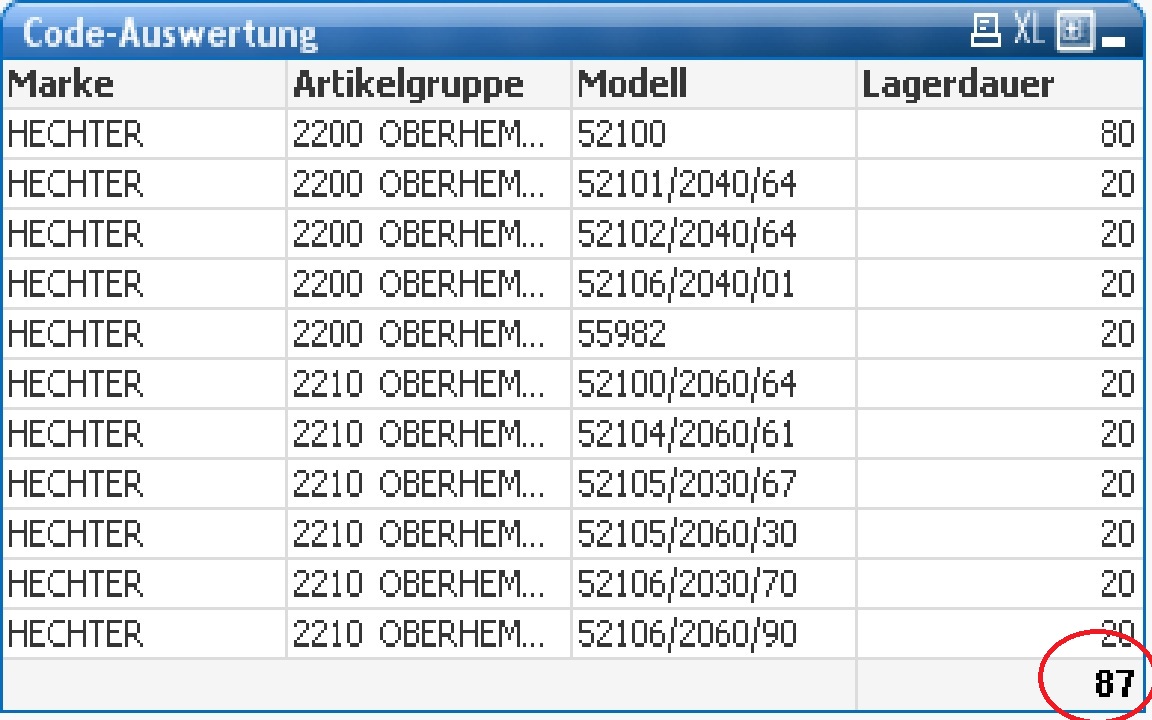
i have a chart and one expressions looks like this: avg(Versand_Dat.VERSADAT) - min(Artikelstamm.WE) for eacht row in the chart the result is right but the total sum in the pivot table is incorrect. I kind of understand why but I don't know how to solve it? I posted a screenshort as an example. in the screenshot you can see that the total sum is incorrect it should be the average of all the other values
can someone help me?
regards,
MT
- Mark as New
- Bookmark
- Subscribe
- Mute
- Subscribe to RSS Feed
- Permalink
- Report Inappropriate Content
A pivot table will always use expression total as total mode. You might want to look into the HELP, sum-of-rows in pivot tables using advanced aggregation.
Something like
=sum( aggr( avg(Versand_Dat.VERSADAT) - min(Artikelstamm.WE), DIM1, DIM2, DIM3))
- Mark as New
- Bookmark
- Subscribe
- Mute
- Subscribe to RSS Feed
- Permalink
- Report Inappropriate Content
I read this already....the problem is that we have a dynamic chart. we are using conditions for the dimensions! and in total I think we have 20 dimensions
- Mark as New
- Bookmark
- Subscribe
- Mute
- Subscribe to RSS Feed
- Permalink
- Report Inappropriate Content
how can I do this in a dynamic chart???