Unlock a world of possibilities! Login now and discover the exclusive benefits awaiting you.
- Qlik Community
- :
- All Forums
- :
- QlikView App Dev
- :
- Color based on %
- Subscribe to RSS Feed
- Mark Topic as New
- Mark Topic as Read
- Float this Topic for Current User
- Bookmark
- Subscribe
- Mute
- Printer Friendly Page
- Mark as New
- Bookmark
- Subscribe
- Mute
- Subscribe to RSS Feed
- Permalink
- Report Inappropriate Content
Color based on %
Dear Experts,
i have google map based on percentage i want to give bubble colors
not sure where im doing wrong i not getting colors on map
please help me on this error
for reference i have attached sample application
Best Regards,
Niranjan
- « Previous Replies
-
- 1
- 2
- Next Replies »
Accepted Solutions
- Mark as New
- Bookmark
- Subscribe
- Mute
- Subscribe to RSS Feed
- Permalink
- Report Inappropriate Content
- Presentation tab-> Uncheck 'Pop-up Labels'
- Expression tab-> Select your expression 'P1Month'-> Check 'Text as pop-up'
- Mark as New
- Bookmark
- Subscribe
- Mute
- Subscribe to RSS Feed
- Permalink
- Report Inappropriate Content
Hi Niranjan,
Please use column() function to specify which column value you want to check and equate a color to.
- Mark as New
- Bookmark
- Subscribe
- Mute
- Subscribe to RSS Feed
- Permalink
- Report Inappropriate Content
Instead of using the background color for your P1Month expression use it for Longitude. It should work. One more thing, I notice values for your variable is same 102.98 for all states. Is that right?
- Mark as New
- Bookmark
- Subscribe
- Mute
- Subscribe to RSS Feed
- Permalink
- Report Inappropriate Content
Hi Tresesco,
Thanks for your reply,
yes the is for all the states for rolling 3 months
how can i validate the map is displaying only 3months values
please suggest me
Best regards,
Niranjan
- Mark as New
- Bookmark
- Subscribe
- Mute
- Subscribe to RSS Feed
- Permalink
- Report Inappropriate Content
Now it's a different question.  Well, you can check your monthly data at state level and check if the latest three months data is summing up to 102.82 or not.
- Mark as New
- Bookmark
- Subscribe
- Mute
- Subscribe to RSS Feed
- Permalink
- Report Inappropriate Content
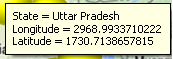
Actually my concern is based on bubble i want to display 3months information of sales
but bubble is displaying different information
i can see longitude and latitude information bubble
Any suggestion how to display expression information on bubble. please help me on this error
Thanks,
Niranjan
- Mark as New
- Bookmark
- Subscribe
- Mute
- Subscribe to RSS Feed
- Permalink
- Report Inappropriate Content
Good Morning to All,
i want to display expression value on google map bubble
Any suggestions
Best Regards,
Niranjan
- Mark as New
- Bookmark
- Subscribe
- Mute
- Subscribe to RSS Feed
- Permalink
- Report Inappropriate Content
in two ways to give the colour to select the custom format cell (cltrl g) than select partcular cell to give condition in the condition which way you want
- Mark as New
- Bookmark
- Subscribe
- Mute
- Subscribe to RSS Feed
- Permalink
- Report Inappropriate Content
Hi Sudhakar,
Thanks for your reply
i want to display expression values on bubble
now on bubble im getting longitude and latitude, but i want to display values
Best Regards,
Niranjan
- Mark as New
- Bookmark
- Subscribe
- Mute
- Subscribe to RSS Feed
- Permalink
- Report Inappropriate Content
- Presentation tab-> Uncheck 'Pop-up Labels'
- Expression tab-> Select your expression 'P1Month'-> Check 'Text as pop-up'
- « Previous Replies
-
- 1
- 2
- Next Replies »