Unlock a world of possibilities! Login now and discover the exclusive benefits awaiting you.
- Qlik Community
- :
- All Forums
- :
- QlikView App Dev
- :
- Cumulated measure
- Subscribe to RSS Feed
- Mark Topic as New
- Mark Topic as Read
- Float this Topic for Current User
- Bookmark
- Subscribe
- Mute
- Printer Friendly Page
- Mark as New
- Bookmark
- Subscribe
- Mute
- Subscribe to RSS Feed
- Permalink
- Report Inappropriate Content
Cumulated measure
Hi guys,
I've a necessity to build a chart with an cumulative calculation.
Dimensions: Container id, Date
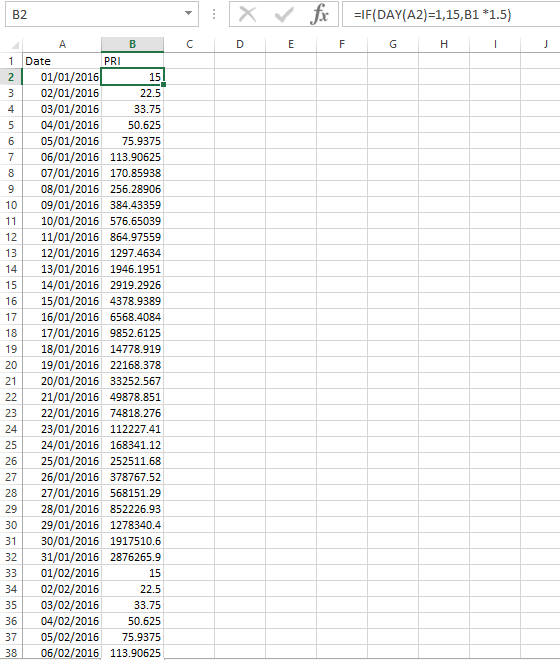
Measures: PRI = if day(Date) = 1 then 1 else TWRR * previous(PRI) end
TWRR is another calculation and can be disregarded.
How to implement this calculation?
Thanks.
- Tags:
- cumulation
- « Previous Replies
- Next Replies »
Accepted Solutions
- Mark as New
- Bookmark
- Subscribe
- Mute
- Subscribe to RSS Feed
- Permalink
- Report Inappropriate Content
Hi,
use above or below as per requirement
try like
expression,
if(day(Date)=1,1,TWRR*above(PRI))
Regards
Please appreciate our Qlik community members by giving Kudos for sharing their time for your query. If your query is answered, please mark the topic as resolved 🙂
- Mark as New
- Bookmark
- Subscribe
- Mute
- Subscribe to RSS Feed
- Permalink
- Report Inappropriate Content
PRI = above(PRI) renders null. I can't reference myself (chart column) in the Above function. I can only reference some other field, right?
- Mark as New
- Bookmark
- Subscribe
- Mute
- Subscribe to RSS Feed
- Permalink
- Report Inappropriate Content
Hi,
PRI is column Name or expression???
Syntax :
Above(expr)
qlik below url for detail understanding of above()
Regards
Please appreciate our Qlik community members by giving Kudos for sharing their time for your query. If your query is answered, please mark the topic as resolved 🙂
- Mark as New
- Bookmark
- Subscribe
- Mute
- Subscribe to RSS Feed
- Permalink
- Report Inappropriate Content
As per the definition, PRI is the name of the calculation. Which is defined in this way:
PRI = if (day(Date) = 1, 1, CONST * prev(PRI))
So, PRI is eventually a chart column which is designed as a static type of a counter which does not depend on any other field in the data model.
Therefore, PRI = above(PRI) seems impossible for me. And I don't see any other way of implementing this formula in Qlikview except for moving it in the script.
Or am I wrong?
- Mark as New
- Bookmark
- Subscribe
- Mute
- Subscribe to RSS Feed
- Permalink
- Report Inappropriate Content
Hi,
I am not getting you..
can you provide sample data with required output???
Regards,
Please appreciate our Qlik community members by giving Kudos for sharing their time for your query. If your query is answered, please mark the topic as resolved 🙂
- Mark as New
- Bookmark
- Subscribe
- Mute
- Subscribe to RSS Feed
- Permalink
- Report Inappropriate Content
Let's start with this one:
for each date I need to make this calculation.
- Mark as New
- Bookmark
- Subscribe
- Mute
- Subscribe to RSS Feed
- Permalink
- Report Inappropriate Content
Is it possible to provide the raw data for this in a Excel file to test it out?
- Mark as New
- Bookmark
- Subscribe
- Mute
- Subscribe to RSS Feed
- Permalink
- Report Inappropriate Content
Sure.
Find below:
| Date | PRI |
| 01/01/2016 | 15 |
| 02/01/2016 | 22.5 |
| 03/01/2016 | 33.75 |
| 04/01/2016 | 50.625 |
| 05/01/2016 | 75.9375 |
| 06/01/2016 | 113.90625 |
| 07/01/2016 | 170.859375 |
| 08/01/2016 | 256.289063 |
| 09/01/2016 | 384.433594 |
| 10/01/2016 | 576.650391 |
| 11/01/2016 | 864.975586 |
| 12/01/2016 | 1297.46338 |
| 13/01/2016 | 1946.19507 |
| 14/01/2016 | 2919.2926 |
| 15/01/2016 | 4378.9389 |
| 16/01/2016 | 6568.40836 |
| 17/01/2016 | 9852.61253 |
| 18/01/2016 | 14778.9188 |
| 19/01/2016 | 22168.3782 |
| 20/01/2016 | 33252.5673 |
| 21/01/2016 | 49878.851 |
| 22/01/2016 | 74818.2764 |
| 23/01/2016 | 112227.415 |
| 24/01/2016 | 168341.122 |
| 25/01/2016 | 252511.683 |
| 26/01/2016 | 378767.524 |
| 27/01/2016 | 568151.287 |
| 28/01/2016 | 852226.93 |
| 29/01/2016 | 1278340.39 |
| 30/01/2016 | 1917510.59 |
| 31/01/2016 | 2876265.89 |
| 01/02/2016 | 15 |
| 02/02/2016 | 22.5 |
| 03/02/2016 | 33.75 |
| 04/02/2016 | 50.625 |
| 05/02/2016 | 75.9375 |
| 06/02/2016 | 113.90625 |
| 07/02/2016 | 170.859375 |
| 08/02/2016 | 256.289063 |
| 09/02/2016 | 384.433594 |
| 10/02/2016 | 576.650391 |
| 11/02/2016 | 864.975586 |
| 12/02/2016 | 1297.46338 |
| 13/02/2016 | 1946.19507 |
| 14/02/2016 | 2919.2926 |
| 15/02/2016 | 4378.9389 |
| 16/02/2016 | 6568.40836 |
| 17/02/2016 | 9852.61253 |
| 18/02/2016 | 14778.9188 |
| 19/02/2016 | 22168.3782 |
| 20/02/2016 | 33252.5673 |
| 21/02/2016 | 49878.851 |
| 22/02/2016 | 74818.2764 |
| 23/02/2016 | 112227.415 |
| 24/02/2016 | 168341.122 |
| 25/02/2016 | 252511.683 |
| 26/02/2016 | 378767.524 |
| 27/02/2016 | 568151.287 |
| 28/02/2016 | 852226.93 |
| 29/02/2016 | 1278340.39 |
- Mark as New
- Bookmark
- Subscribe
- Mute
- Subscribe to RSS Feed
- Permalink
- Report Inappropriate Content
Isn't this the output you are looking to get? What is CONST here?
- « Previous Replies
- Next Replies »