Unlock a world of possibilities! Login now and discover the exclusive benefits awaiting you.
- Qlik Community
- :
- All Forums
- :
- QlikView
- :
- Maximum value over a dimension
- Subscribe to RSS Feed
- Mark Topic as New
- Mark Topic as Read
- Float this Topic for Current User
- Bookmark
- Subscribe
- Mute
- Printer Friendly Page
- Mark as New
- Bookmark
- Subscribe
- Mute
- Subscribe to RSS Feed
- Permalink
- Report Inappropriate Content
Maximum value over a dimension
Apologies if this question has been answered previously!
My data is as follows:
| Code | Date | Value |
|---|---|---|
| A | 10/11/2012 | 10 |
| A | 11/11/2012 | 12 |
| A | 16/11/2012 | 13 |
| B | 10/11/2012 | 27 |
| C | 11/11/2012 | 6 |
| C | 13/11/2012 | 8 |
| C | 15/11/2012 | 13 |
I would like a chart over dimension Code, selecting just the single value for each Code with the latest (MAX) date.
ie. A=13, B=27 and C=13 (ultimately, I will be summing all these values).
Advice please 
Thanks
- Tags:
- max_date
- max_record
Accepted Solutions
- Mark as New
- Bookmark
- Subscribe
- Mute
- Subscribe to RSS Feed
- Permalink
- Report Inappropriate Content
Try
=FirstSortedValue(Value, -Date)
as expression (Date should be interpreted as Date with a numeric representation by QV already), using Code as dimension.
- Mark as New
- Bookmark
- Subscribe
- Mute
- Subscribe to RSS Feed
- Permalink
- Report Inappropriate Content
Try
=FirstSortedValue(Value, -Date)
as expression (Date should be interpreted as Date with a numeric representation by QV already), using Code as dimension.
- Mark as New
- Bookmark
- Subscribe
- Mute
- Subscribe to RSS Feed
- Permalink
- Report Inappropriate Content
hi
if u think that maxvalue is always calculated only for latest date then u can write max(only{<date=${'maxdate'}>} value)
so create a maxdate variable
- Mark as New
- Bookmark
- Subscribe
- Mute
- Subscribe to RSS Feed
- Permalink
- Report Inappropriate Content
Thank you !
I have not used that function before 
- Mark as New
- Bookmark
- Subscribe
- Mute
- Subscribe to RSS Feed
- Permalink
- Report Inappropriate Content
Hi Stefan,
I have a similar requirement
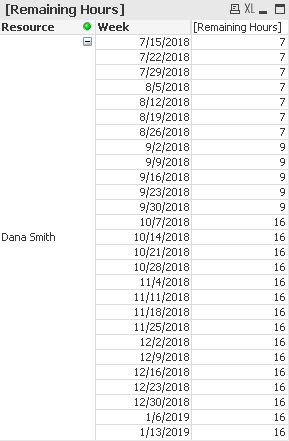
This is how my chart looks like now:
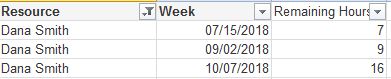
I want the chart like this:
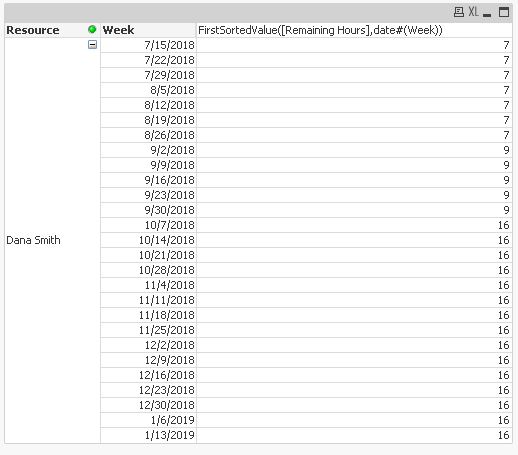
With Week also added as a dimension in the chart (along with resourcename), the firstsortvalue then sorts for each week. So I get the same thing:
Expression: FirstSortedValue([Remaining Hours],date#(Week))
But I get the same chart:
Is there any way to do what I'm looking for?
Thanks,
YASH
- Mark as New
- Bookmark
- Subscribe
- Mute
- Subscribe to RSS Feed
- Permalink
- Report Inappropriate Content
Use Remaining Hours as second dimension and Min(Week) as expression.