Unlock a world of possibilities! Login now and discover the exclusive benefits awaiting you.
- Qlik Community
- :
- All Forums
- :
- QlikView App Dev
- :
- Re: Pivot table issue
- Subscribe to RSS Feed
- Mark Topic as New
- Mark Topic as Read
- Float this Topic for Current User
- Bookmark
- Subscribe
- Mute
- Printer Friendly Page
- Mark as New
- Bookmark
- Subscribe
- Mute
- Subscribe to RSS Feed
- Permalink
- Report Inappropriate Content
Pivot table issue
Hi ,
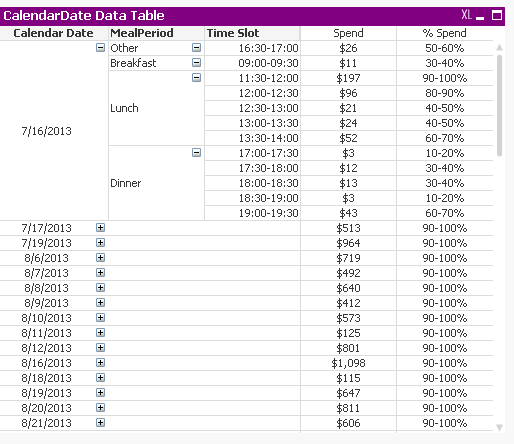
I created a pivot table with four dimensions and 2 Kpi's.
i can see the correct values, when i expand all the dimensions at one time.
if i expand dimension by dimension wise, i am not able to see the correct kpi values.
can any one help me.
- Mark as New
- Bookmark
- Subscribe
- Mute
- Subscribe to RSS Feed
- Permalink
- Report Inappropriate Content
Will have to look into it. Will get back in a while. However mentioning Sunny if he has any quick resolution for this, i vaguely remember he did fix something like this long ago.
Hey stalwar1 would you mind looking into this please.
- Mark as New
- Bookmark
- Subscribe
- Mute
- Subscribe to RSS Feed
- Permalink
- Report Inappropriate Content
May be this?
=if(((count(total aggr( sum(TotalPaid),ServDate,MealPeriod,[Time Slot]))) - (If(Dimensionality() = 3, Aggr(Rank(Total sum(TotalPaid)/v1), ServDate,MealPeriod,[Time Slot]), Rank(Total sum(TotalPaid)/v1))))
/
(count(total aggr( sum(TotalPaid),ServDate,MealPeriod,[Time Slot])))<0.1,'0-10%',
if(((count(total aggr( sum(TotalPaid),ServDate,MealPeriod,[Time Slot]))) - (If(Dimensionality() = 3, Aggr(Rank(Total sum(TotalPaid)/v1), ServDate,MealPeriod,[Time Slot]), Rank(Total sum(TotalPaid)/v1))))
/
(count(total aggr( sum(TotalPaid),ServDate,MealPeriod,[Time Slot])))<0.2,'10-20%',
if(((count(total aggr( sum(TotalPaid),ServDate,MealPeriod,[Time Slot]))) - (If(Dimensionality() = 3, Aggr(Rank(Total sum(TotalPaid)/v1), ServDate,MealPeriod,[Time Slot]), Rank(Total sum(TotalPaid)/v1))))
/
(count(total aggr( sum(TotalPaid),ServDate,MealPeriod,[Time Slot])))<0.3,'20-30%',
if(((count(total aggr( sum(TotalPaid),ServDate,MealPeriod,[Time Slot]))) - (If(Dimensionality() = 3, Aggr(Rank(Total sum(TotalPaid)/v1), ServDate,MealPeriod,[Time Slot]), Rank(Total sum(TotalPaid)/v1))))
/
(count(total aggr( sum(TotalPaid),ServDate,MealPeriod,[Time Slot])))<0.4,'30-40%',
if(((count(total aggr( sum(TotalPaid),ServDate,MealPeriod,[Time Slot]))) - (If(Dimensionality() = 3, Aggr(Rank(Total sum(TotalPaid)/v1), ServDate,MealPeriod,[Time Slot]), Rank(Total sum(TotalPaid)/v1))))
/
(count(total aggr( sum(TotalPaid),ServDate,MealPeriod,[Time Slot])))<0.5,'40-50%',
if(((count(total aggr( sum(TotalPaid),ServDate,MealPeriod,[Time Slot]))) - (If(Dimensionality() = 3, Aggr(Rank(Total sum(TotalPaid)/v1), ServDate,MealPeriod,[Time Slot]), Rank(Total sum(TotalPaid)/v1))))
/
(count(total aggr( sum(TotalPaid),ServDate,MealPeriod,[Time Slot])))<0.6,'50-60%',
if(((count(total aggr( sum(TotalPaid),ServDate,MealPeriod,[Time Slot]))) - (If(Dimensionality() = 3, Aggr(Rank(Total sum(TotalPaid)/v1), ServDate,MealPeriod,[Time Slot]), Rank(Total sum(TotalPaid)/v1))))
/
(count(total aggr( sum(TotalPaid),ServDate,MealPeriod,[Time Slot])))<0.7,'60-70%',
if(((count(total aggr( sum(TotalPaid),ServDate,MealPeriod,[Time Slot]))) - (If(Dimensionality() = 3, Aggr(Rank(Total sum(TotalPaid)/v1), ServDate,MealPeriod,[Time Slot]), Rank(Total sum(TotalPaid)/v1))))
/
(count(total aggr( sum(TotalPaid),ServDate,MealPeriod,[Time Slot])))<0.8,'70-80%',
if(((count(total aggr( sum(TotalPaid),ServDate,MealPeriod,[Time Slot]))) - (If(Dimensionality() = 3, Aggr(Rank(Total sum(TotalPaid)/v1), ServDate,MealPeriod,[Time Slot]), Rank(Total sum(TotalPaid)/v1))))
/
(count(total aggr( sum(TotalPaid),ServDate,MealPeriod,[Time Slot])))<0.9,'80-90%','90-100%')))))))))
- Mark as New
- Bookmark
- Subscribe
- Mute
- Subscribe to RSS Feed
- Permalink
- Report Inappropriate Content
Thanks Sunny. That is awesome.
Ravi, as mentioned before anyways you are getting your count totals from your variable v1. You can just use this in your spend % to make it more comprehensive. Just replaced that count total with variable v1.
=if(((v1) - (If(Dimensionality() = 3, Aggr(Rank(Total sum(TotalPaid)/v1), ServDate,MealPeriod,[Time Slot]), Rank(Total sum(TotalPaid)/v1))))/(v1)<0.1,'0-10%',
if(((v1) - (If(Dimensionality() = 3, Aggr(Rank(Total sum(TotalPaid)/v1), ServDate,MealPeriod,[Time Slot]), Rank(Total sum(TotalPaid)/v1)))) /(v1)<0.2,'10-20%',
if(((v1) - (If(Dimensionality() = 3, Aggr(Rank(Total sum(TotalPaid)/v1), ServDate,MealPeriod,[Time Slot]), Rank(Total sum(TotalPaid)/v1)))) /(v1)<0.3,'20-30%',
if(((v1) - (If(Dimensionality() = 3, Aggr(Rank(Total sum(TotalPaid)/v1), ServDate,MealPeriod,[Time Slot]), Rank(Total sum(TotalPaid)/v1)))) /(v1)<0.4,'30-40%',
if(((v1) - (If(Dimensionality() = 3, Aggr(Rank(Total sum(TotalPaid)/v1), ServDate,MealPeriod,[Time Slot]), Rank(Total sum(TotalPaid)/v1)))) /(v1)<0.5,'40-50%',
if(((v1) - (If(Dimensionality() = 3, Aggr(Rank(Total sum(TotalPaid)/v1), ServDate,MealPeriod,[Time Slot]), Rank(Total sum(TotalPaid)/v1)))) /(v1)<0.6,'50-60%',
if(((v1) - (If(Dimensionality() = 3, Aggr(Rank(Total sum(TotalPaid)/v1), ServDate,MealPeriod,[Time Slot]), Rank(Total sum(TotalPaid)/v1)))) /(v1)<0.7,'60-70%',
if(((v1) - (If(Dimensionality() = 3, Aggr(Rank(Total sum(TotalPaid)/v1), ServDate,MealPeriod,[Time Slot]), Rank(Total sum(TotalPaid)/v1)))) /(v1)<0.8,'70-80%',
if(((v1) - (If(Dimensionality() = 3, Aggr(Rank(Total sum(TotalPaid)/v1), ServDate,MealPeriod,[Time Slot]), Rank(Total sum(TotalPaid)/v1)))) /(v1)<0.9,'80-90%','90-100%')))))))))
- Mark as New
- Bookmark
- Subscribe
- Mute
- Subscribe to RSS Feed
- Permalink
- Report Inappropriate Content
Thanks a lot Sunny and Viswanath.
Its working fine.
- Mark as New
- Bookmark
- Subscribe
- Mute
- Subscribe to RSS Feed
- Permalink
- Report Inappropriate Content
Glad we were able to help. Please close the thread by marking the correct response
Qlik Community Tip: Marking Replies as Correct or Helpful
Best,
Sunny
- Mark as New
- Bookmark
- Subscribe
- Mute
- Subscribe to RSS Feed
- Permalink
- Report Inappropriate Content
And his name is Vishwarath 
- Mark as New
- Bookmark
- Subscribe
- Mute
- Subscribe to RSS Feed
- Permalink
- Report Inappropriate Content
Hi Sunny,
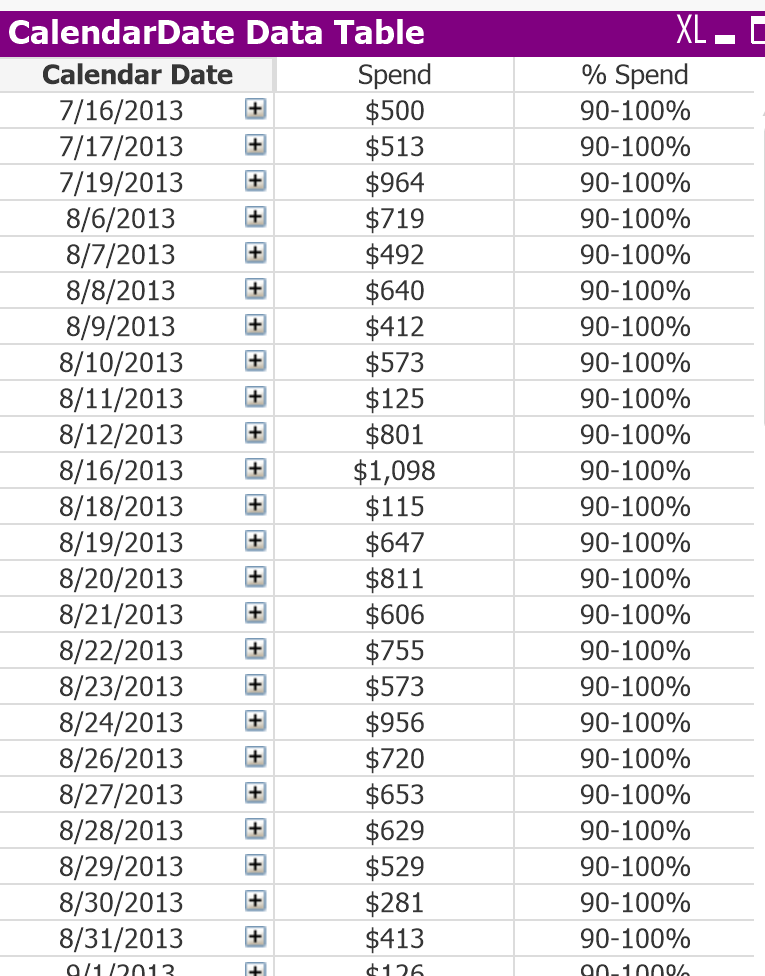
By Default the first dimension is showing 90-100%, is it possible to restrict this?it suppose to show calendar date wise.While expanding , it is working fine with other dimensions.
- Mark as New
- Bookmark
- Subscribe
- Mute
- Subscribe to RSS Feed
- Permalink
- Report Inappropriate Content
Not sure I understand your question? What do you want to see instead of 90-100%?
- Mark as New
- Bookmark
- Subscribe
- Mute
- Subscribe to RSS Feed
- Permalink
- Report Inappropriate Content
Your spend is calculated based on the IF condition for Total spend and value your variable holds with a range.
- Mark as New
- Bookmark
- Subscribe
- Mute
- Subscribe to RSS Feed
- Permalink
- Report Inappropriate Content
Every calendar date has its own %Spend Value, but here it is same for all the dates.