Unlock a world of possibilities! Login now and discover the exclusive benefits awaiting you.
- Qlik Community
- :
- All Forums
- :
- QlikView App Dev
- :
- Previous Year Sales On Current year Bar
- Subscribe to RSS Feed
- Mark Topic as New
- Mark Topic as Read
- Float this Topic for Current User
- Bookmark
- Subscribe
- Mute
- Printer Friendly Page
- Mark as New
- Bookmark
- Subscribe
- Mute
- Subscribe to RSS Feed
- Permalink
- Report Inappropriate Content
Previous Year Sales On Current year Bar
Hi Friends ,
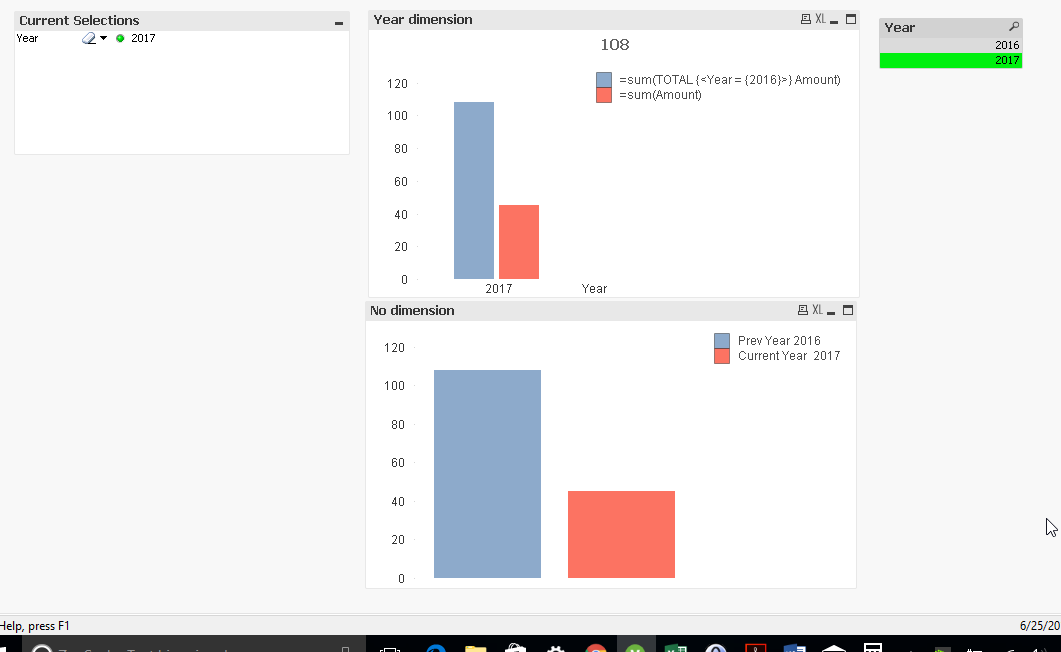
I have a situation , i have selected yes from my year filter , and i am showing , current year sales and previous year sales , but it is giving 2 years in X axis , one for current and one for previous ,
I want Prevous sales bar should come with current year bar.
- Mark as New
- Bookmark
- Subscribe
- Mute
- Subscribe to RSS Feed
- Permalink
- Report Inappropriate Content
swuehl any help on this please.
- Mark as New
- Bookmark
- Subscribe
- Mute
- Subscribe to RSS Feed
- Permalink
- Report Inappropriate Content
Hi,
Dimension Year
Expression Sum({<Year={'>=$(=Max(Year))<=$(=Max(Year)-1)'}>} Amount)

Regards,
Antonio
- Mark as New
- Bookmark
- Subscribe
- Mute
- Subscribe to RSS Feed
- Permalink
- Report Inappropriate Content
Not sure what you mean with 'selected yes from my year filter'
You also don't mention what should be shown with no value selected.
You can probably do what you want using set analysis in your two expressions to filter on the years to compare and either use no dimension or a TOTAL qualifier. See attached.
Or use chart inter record functions like above, maybe in combination with advanced aggregation, or have a look at AsOf tables as described e.g. in
- Mark as New
- Bookmark
- Subscribe
- Mute
- Subscribe to RSS Feed
- Permalink
- Report Inappropriate Content
Thanks
'selected yes from my year filter'
I was writing, Selecting Year from list box,
But I need Year as a dimension in the chart and on nothing selection, I want all years should come.
- Mark as New
- Bookmark
- Subscribe
- Mute
- Subscribe to RSS Feed
- Permalink
- Report Inappropriate Content
Then you can use for example chart inter record functions (in combination with advanced aggregation) or an AsOf table aaproach (or may also other approaches, depending on what you really need to achieve).
For example:
=Sum(Amount)
=Aggr(Above(Sum({1} Amount)),(Year,(NUMERIC,ASC) ) )
in your chart with dimension Year.
- Mark as New
- Bookmark
- Subscribe
- Mute
- Subscribe to RSS Feed
- Permalink
- Report Inappropriate Content
As of table seems good approach , thanks Stefan ! 