Unlock a world of possibilities! Login now and discover the exclusive benefits awaiting you.
- Qlik Community
- :
- All Forums
- :
- QlikView App Dev
- :
- Set analysis for choosing a rank
- Subscribe to RSS Feed
- Mark Topic as New
- Mark Topic as Read
- Float this Topic for Current User
- Bookmark
- Subscribe
- Mute
- Printer Friendly Page
- Mark as New
- Bookmark
- Subscribe
- Mute
- Subscribe to RSS Feed
- Permalink
- Report Inappropriate Content
Set analysis for choosing a rank
Hi QV Champions.
I am stuck in a situation where I need to make charts based on a particular ranking object. The Chart I have made is as follows
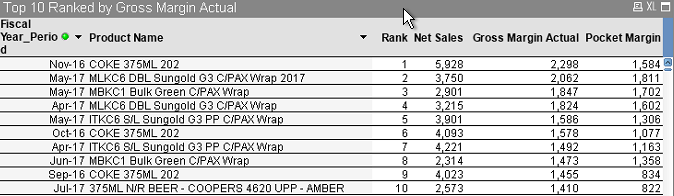
Here I have products and Net Sales, Gross margin and Pocket margin. I have rank expression is : Rank(Total sum(Gross Margin Actual),1).
I want to make 10 charts : the first for the product that is rank 1,another for product that is rank 2 and so on until 10.
All suggestions welcome, especially if we can use a set analysis based on rank.
Cheers
- Mark as New
- Bookmark
- Subscribe
- Mute
- Subscribe to RSS Feed
- Permalink
- Report Inappropriate Content
Hi,
You can write like this,
Rank 1:
=only(aggr(if(rank(sum(Gross Margin Actual)),4)=1, [Product Name]), [Product Name]))
Rank 2:
=only(aggr(if(rank(sum(Gross Margin Actual)),4)=2, [Product Name]), [Product Name]))
FYI,
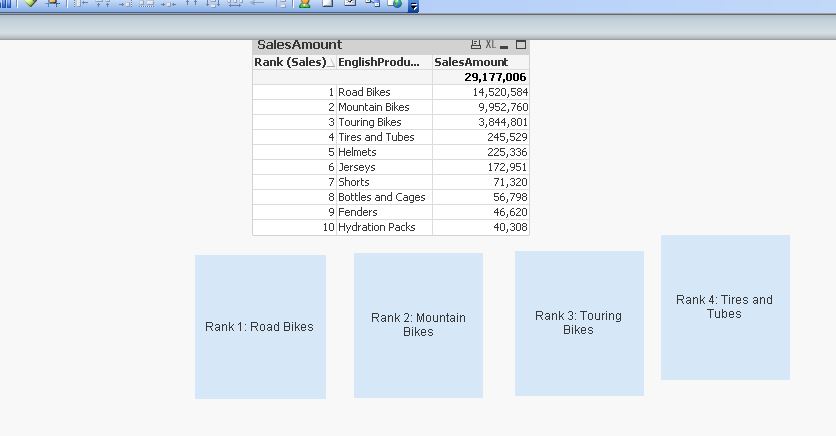
Mock app,
- Mark as New
- Bookmark
- Subscribe
- Mute
- Subscribe to RSS Feed
- Permalink
- Report Inappropriate Content
Thanks for reply devarasu07
My idea is I should one chart which only has one product coke 375 ml, another chart only having MLKC6 DBL
- Mark as New
- Bookmark
- Subscribe
- Mute
- Subscribe to RSS Feed
- Permalink
- Report Inappropriate Content
Hi,
Yes it should work. give a try and let us know if still have issue send us the mock app with source and expected output in excel will try to help you. tks
Regards,
Deva
- Mark as New
- Bookmark
- Subscribe
- Mute
- Subscribe to RSS Feed
- Permalink
- Report Inappropriate Content
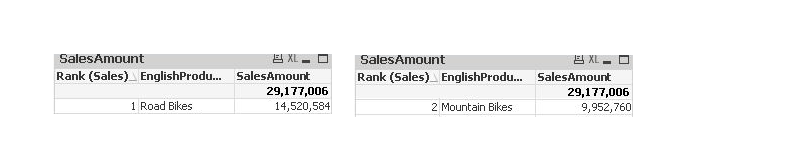
Will this method also produce charts like this?