Unlock a world of possibilities! Login now and discover the exclusive benefits awaiting you.
- Qlik Community
- :
- All Forums
- :
- QlikView App Dev
- :
- Sorting in pivot tables
- Subscribe to RSS Feed
- Mark Topic as New
- Mark Topic as Read
- Float this Topic for Current User
- Bookmark
- Subscribe
- Mute
- Printer Friendly Page
- Mark as New
- Bookmark
- Subscribe
- Mute
- Subscribe to RSS Feed
- Permalink
- Report Inappropriate Content
Sorting in pivot tables
hi all,
I have a pivot table for sales by product by period, and the users of this file want to be able to sort by any column. Can this be done in a pivot table? I know you can simply double click on a column heading in a straight table and it will sort on that column, but they want the selected periods to be accross the page, but be able to sort by any column.
I have attached a sample file, it is pretty basic way of looking at it.
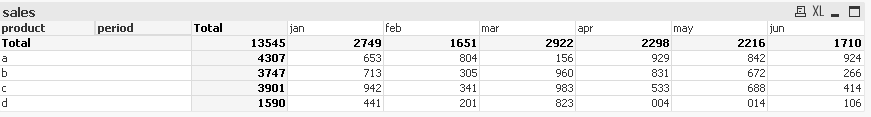
The chart looks like this.
I hope this all makes sense
Regards
Josh
- « Previous Replies
-
- 1
- 2
- Next Replies »
- Mark as New
- Bookmark
- Subscribe
- Mute
- Subscribe to RSS Feed
- Permalink
- Report Inappropriate Content
Hi Josh,
sorting in Pivot table is possible only based on the dimensions and it can be done only through chart properties>Sort window alone.
Regards,
Raghav
- Mark as New
- Bookmark
- Subscribe
- Mute
- Subscribe to RSS Feed
- Permalink
- Report Inappropriate Content
I thought that was the case, is there any way of having a table like the one above with the options I want? So Product down the page, period accross the page, and then sort by sales...
The issue is that the client I am developing this for has used a previous product that let them do it, and I am trying to make sure they don't lose functionality when moving to QlikView.
- Mark as New
- Bookmark
- Subscribe
- Mute
- Subscribe to RSS Feed
- Permalink
- Report Inappropriate Content
Hi,
You can create a straight table with one expression for each period (apr, may etc) and put in a condition in the presentation tab> Columns>Conditional> "= if(wildmatch(GetFieldSelections(period),'*apr*')=1,1,0)" .
This approach will give you the same effect which you have in Pivot table.
Regards,
Raghav
- Mark as New
- Bookmark
- Subscribe
- Mute
- Subscribe to RSS Feed
- Permalink
- Report Inappropriate Content
You could possibly do something in code giving them the different sort options...
Theb attached example shows a table by analysis period....
Clicking on the sort button sorts by period Ascending / Descending...
Regards
Paul
- Mark as New
- Bookmark
- Subscribe
- Mute
- Subscribe to RSS Feed
- Permalink
- Report Inappropriate Content
I thought about the straight table option, however the periods are not just simply jan, feb, mar, etc. they are jan-11, feb-11, ... jan-12, feb-12, etc. So I would have to update this table every now and then to add additional periods.
- Mark as New
- Bookmark
- Subscribe
- Mute
- Subscribe to RSS Feed
- Permalink
- Report Inappropriate Content
Hi Paul,
I have tried something like this, I have created buttons and options to let them sort by an expression, the issue is that the amount of data there is, if I try and do it as an expression and do the filtering within the expression then it is taking a rediculous amount of time to calculate. Eg. select a period, an expression and then an ascending or descending and then press sort button.
I think the answer is bad luck, it kind of has to be a pivot table to get the periods accross the top, so I might just need to give them the option telling them that it will be slow.
unless someone has some other brain wave...
cheers
josh
- Mark as New
- Bookmark
- Subscribe
- Mute
- Subscribe to RSS Feed
- Permalink
- Report Inappropriate Content
Hi,
If you think adding expressions dynamically based on the new months adding to the data, you can try using the macro running after the application reload.
So this particluar macro will delete the existing expressions and will add new expressions for all the periods loaded that time.
Please have a look at the attached app.
- Mark as New
- Bookmark
- Subscribe
- Mute
- Subscribe to RSS Feed
- Permalink
- Report Inappropriate Content
Here's a dynamic and scalable solution I came up with today, hope this answers the OP's question...
The Goal:
Sort expression columns in a pivot table
The Method:
1. Create variables for the expressions you want to sort by
LET vEqProjectBaseline = 'Sum([BackingSheetHours]) /7.5';
LET vEqEstimate = 'Sum(Aggr([Estimated Hours], ProjectTaskKey)) /7.5';
LET vEqBaselineVsEstimate = '($(vEqEstimate)) / ($(vEqProjectBaseline))';
N.B – brackets and apostrophes are a real minefield
2. Create function to evaluate the variables inline
SET fxEval = Evaluate($1);
3. Create the custom sort table:
CustomSorting:
LOAD %DisplayValue
,%ExVariable
,$(fxEval(%ExVariable)) as %SortingExpression
Inline
[
%DisplayValue ,%ExVariable
Project Baseline ,vEqProjectBaseline
Estimate ,vEqEstimate
Baseline vs Estimate ,vEqBaselineVsEstimate
];
4. Set the sort expression in the pivot table:
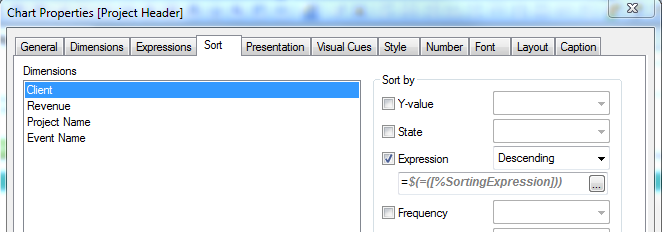
5. Create a selector for the sorting options (I used %DisplayValue in this example)
The Goods:
Adds sorting to pivot tables
Doesn’t seem to affect performance (not yet tested on large datasets)
The Bads:
This will probably be a bummer to maintain (– I’m thinking mismatching expressions between the table and the variables)
Takes a couple of hours to set up and test
You'll only be able to sort ASC [OR] DESC, not have the option of both
Hope that helps!
Rich
- Mark as New
- Bookmark
- Subscribe
- Mute
- Subscribe to RSS Feed
- Permalink
- Report Inappropriate Content
Hello,
Thx for help.
I have
Columns selected years amount of sales product
e.g.
2014 2013
product1 19 12
product2 15 13
product3 14 12
when i use sort expression sales, it counts all years together and then sorts
but i want to sort on first year selected, not knowing which year it is.
how to do that?
- « Previous Replies
-
- 1
- 2
- Next Replies »