Unlock a world of possibilities! Login now and discover the exclusive benefits awaiting you.
- Qlik Community
- :
- All Forums
- :
- QlikView App Dev
- :
- Re: stacked bar chart
- Subscribe to RSS Feed
- Mark Topic as New
- Mark Topic as Read
- Float this Topic for Current User
- Bookmark
- Subscribe
- Mute
- Printer Friendly Page
- Mark as New
- Bookmark
- Subscribe
- Mute
- Subscribe to RSS Feed
- Permalink
- Report Inappropriate Content
stacked bar chart
Hi
I want to create a stacked bar chart in My qv document attached herewith. I want to to have two bar chart for Actual and budget.
In the each bar chart % of items give should appear. Pls help me to do this from QV document
- « Previous Replies
-
- 1
- 2
- Next Replies »
- Mark as New
- Bookmark
- Subscribe
- Mute
- Subscribe to RSS Feed
- Permalink
- Report Inappropriate Content
You want a stacked bar chart or you don't want a stacked bar chart?
- Mark as New
- Bookmark
- Subscribe
- Mute
- Subscribe to RSS Feed
- Permalink
- Report Inappropriate Content
Yes I want a stack bar chart with two separate bars for actual and budget
- Mark as New
- Bookmark
- Subscribe
- Mute
- Subscribe to RSS Feed
- Permalink
- Report Inappropriate Content
I think may not be possible to do with two dimensions and two expressions. Can you may be remove the MONTH dimension? or is that something you would need to see?
- Mark as New
- Bookmark
- Subscribe
- Mute
- Subscribe to RSS Feed
- Permalink
- Report Inappropriate Content
Hi,
Stacked bar chart is shown in the qvw provided. If you want grouped bar chart, then remove one dimension (Month in your case).
Regards,
Anjali Gupta
- Mark as New
- Bookmark
- Subscribe
- Mute
- Subscribe to RSS Feed
- Permalink
- Report Inappropriate Content
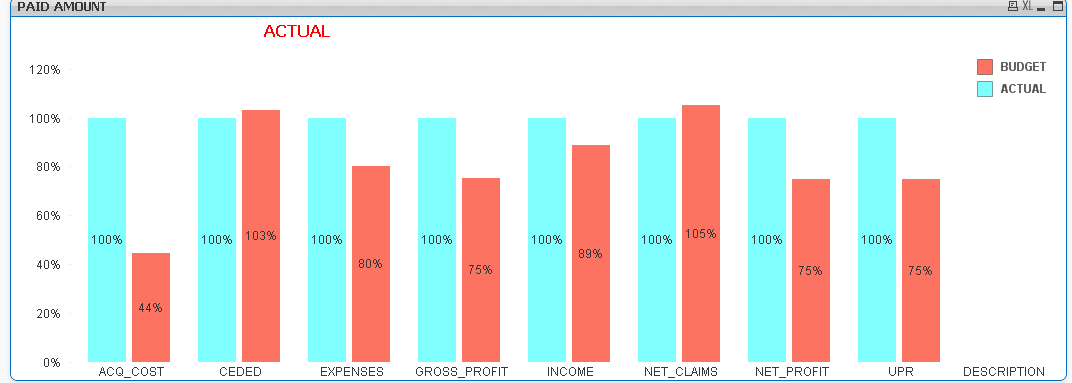
Like this?
- Mark as New
- Bookmark
- Subscribe
- Mute
- Subscribe to RSS Feed
- Permalink
- Report Inappropriate Content
No harm Month can be removed
- Mark as New
- Bookmark
- Subscribe
- Mute
- Subscribe to RSS Feed
- Permalink
- Report Inappropriate Content
if Month is removed then your task is done.
- Mark as New
- Bookmark
- Subscribe
- Mute
- Subscribe to RSS Feed
- Permalink
- Report Inappropriate Content
Then I think you just need to remove Month and change from Stacked to Group on the Style tab
- Mark as New
- Bookmark
- Subscribe
- Mute
- Subscribe to RSS Feed
- Permalink
- Report Inappropriate Content
Your one is some what equal to what I want . Bud the bar should represent % of Come as follows. If we go only upto Gross Profit level
| INCOME | 5,350,000 | |
| CEDED | 970,000 | 18% |
| UPR | 400,000 | 7% |
| NET_CLAIMS | 2,000,000 | 37% |
| ACQ_COST | 450,000 | 8% |
| GROSS_PROFIT | 1,530,000 | 29% |
Total % should be equal to 100%
- « Previous Replies
-
- 1
- 2
- Next Replies »