Unlock a world of possibilities! Login now and discover the exclusive benefits awaiting you.
- Qlik Community
- :
- All Forums
- :
- QlikView Administration
- :
- Re: Performance issue in LineChart
- Subscribe to RSS Feed
- Mark Topic as New
- Mark Topic as Read
- Float this Topic for Current User
- Bookmark
- Subscribe
- Mute
- Printer Friendly Page
- Mark as New
- Bookmark
- Subscribe
- Mute
- Subscribe to RSS Feed
- Permalink
- Report Inappropriate Content
Performance issue in LineChart
Hi qlikview team,
Currently facing big problem on performance in web browser.
My present application size is 3.5 GB. Now in app having "TimeSeries" sheet containing LineChart with 1 dimension and 7 expression as below :
CaptureTimeSPCRange is a variable in "Slider Object" having time intervals 5,10,15,....60.
Is there any way to improve performance and make faster in selections ?
Dimension :
=Date(CaptureDateTime,'M/D/YY')&' '&Pick(WildMatch(CaptureTimeSPCRange,'5','10','15','20','25','30','35','40','45','50','55','60'),[5mins],[10mins],[15mins],[20mins],[25mins],[30mins],[35mins],[40mins],[45mins],[50mins],[55mins],[60mins])
Expressions :
1.)LotNo
='Lot = ' & LotNo
2.)Defective Lens Rate
1000000*count({$<LensResult={"Fail"}, DefectStatus= {"Fail"} >} DISTINCT LensKey)
/count({$ <LensResult={"Fail","Pass"}, DefectStatus = {"Fail","Pass"}, [Defect Name] =>} DISTINCT LensKey)
3.)LensCount
count({$ <[Defect Name] = >} DISTINCT LensKey)
4.)Avg
1000000*count( {$<LensResult={"Fail"}, DefectStatus= {"Fail"}>} Distinct Total LensKey)
/count({$ <LensResult={"Fail","Pass"}, DefectStatus = {"Fail","Pass"}, [Defect Name] =>} DISTINCT TOTAL LensKey)
5.)UCL
=Avg. + Mediandiff/MediantoSconversion * 3
6.)LCL
if((Avg. - Mediandiff/$(MediantoSconversion) * 3) < 0, .00001, (Avg. - Mediandiff/$(MediantoSconversion) * 3) )
7.)Mediandiff
median ( Total aggr( 1000000*(fabs(count({$<LensResult={"Fail"}, DefectStatus= {"Fail"} >} DISTINCT LensKey)
/count({$ <LensResult={"Fail","Pass"}, DefectStatus = {"Fail","Pass"}, [Defect Name] =>} DISTINCT LensKey)
-
count({$<LensResult={"Fail"}, DefectStatus= {"Fail"} >} DISTINCT Total LensKey)
/count({$ <LensResult={"Fail","Pass"}, DefectStatus = {"Fail","Pass"}, [Defect Name] =>} DISTINCT Total LensKey))), LotNo ))
Highly appreciated your ideas on this.
Thanks in advance.
- Tags:
- qlikview_deployment
- Mark as New
- Bookmark
- Subscribe
- Mute
- Subscribe to RSS Feed
- Permalink
- Report Inappropriate Content
Just to get you started, avoid calculated dimensions at any cost.
- Mark as New
- Bookmark
- Subscribe
- Mute
- Subscribe to RSS Feed
- Permalink
- Report Inappropriate Content
hi Daniel,
Thanks for reply.
Actually my dimension will be changed based on selected value in Slider object.
Ex 1: if my slider set to 5 then dimension should be as follows:
Date(CaptureDateTime,'M/D/YY')&' '&[5 Mins]
Ex 2: if my slider set to 10 then dimension should be as follows :
Date(CaptureDateTime,'M/D/YY')&' '&[10 Mins]
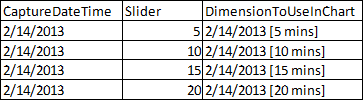
So whatever the user selected value in slider object is currently taken as dimension filed as follows and here CaptureTimeSPCRange is the variable name for the slider object.
=Date(CaptureDateTime,'M/D/YY')&' '&Pick(WildMatch(CaptureTimeSPCRange,'5','10','15','20','25','30','35','40','45','50','55','60'),[5mins],[10mins],[15mins],[20mins],[25mins],[30mins],[35mins],[40mins],[45mins],[50mins],[55mins],[60mins])
Is there any other better way to avoid this calculated dimension and also should work same as above dimension.
Please let me know the better solution to avoid performance issue.
thanks in advance.
- Mark as New
- Bookmark
- Subscribe
- Mute
- Subscribe to RSS Feed
- Permalink
- Report Inappropriate Content
Create a new dimension, something like this
- Mark as New
- Bookmark
- Subscribe
- Mute
- Subscribe to RSS Feed
- Permalink
- Report Inappropriate Content
hi Daniel,
Sorry for late reply.
I tried to achieve what you said in creating new dimension but bad i didn't reached properly.
Can you please find the attached sample file and let me know how and where i can create a new dimension in this.
Thanks in advance.
- Mark as New
- Bookmark
- Subscribe
- Mute
- Subscribe to RSS Feed
- Permalink
- Report Inappropriate Content
Hi,
Still waiting for solution in increasing performance in line chart .
Any help on this great appreciated.
Thanks in advance.
- Mark as New
- Bookmark
- Subscribe
- Mute
- Subscribe to RSS Feed
- Permalink
- Report Inappropriate Content
Can see any increase if you remove the Date function from : Date(CaptureDateTime,'M/D/YY')
Do you have to format it? Can't you format the data used in CaptureDateTime in the script?
- Mark as New
- Bookmark
- Subscribe
- Mute
- Subscribe to RSS Feed
- Permalink
- Report Inappropriate Content
hi jerry svenson,
thanks for reply.
I'm not sure this might work in increasing the performance, but i will cross check and let you know by removing timestamp in dimension.
Thanks in advance.