Hi Qlikers,
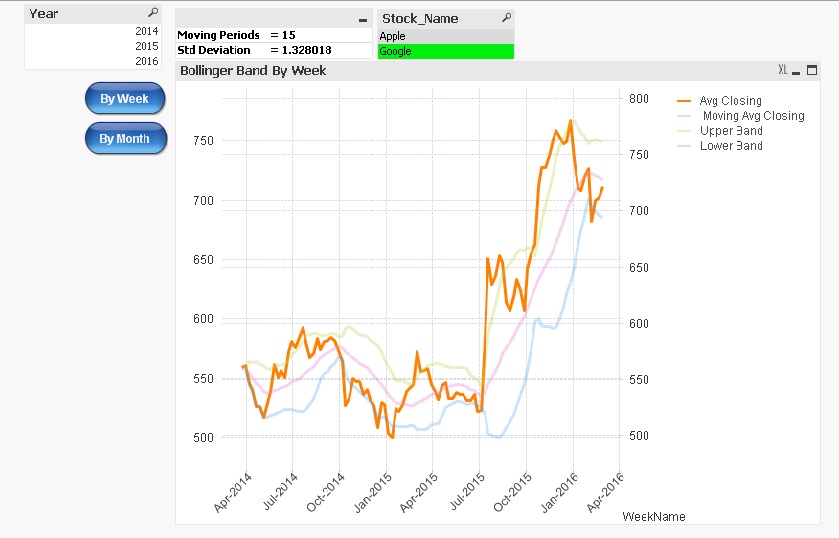
This document demonstrates the Bollinger Bands.
Many traders use Bollinger Bands to determine overbought and oversold levels, selling when price touches the upper Bollinger Band and buying when it hits the lower Bollinger Band.
Components of Bollinger Bands
1) Avg Stock Price
It's simple Avg of stock price.
2) Moving Avg of Stock Price
It's Moving Avg of Stock price over last n Period
3) Upper Band
Moving Avg of Stock Price + Std Deviation over last n Period * Std Deviation Multiplier
4) Lower Band
Moving Avg of Stock Price - Std Deviation over last n Period * Std Deviation Multiplier
Note :
1) User can select the Moving period and Std Deviation multiplier by own.
2) When you see the Bollinger Band by week, you can choose the Moving period from 1 to 50.
3) When you see the Bollinger Band by month, you can choose the Moving period from 1 to 10.
4) You can input the Std Deviation multiplier from 0.01 to 4.
Please see the attached Application
If you liked this then also see
Benford's law
Control Chart