Unlock a world of possibilities! Login now and discover the exclusive benefits awaiting you.
- Qlik Community
- :
- Forums
- :
- Analytics
- :
- QlikView
- :
- Documents
- :
- gauge chart.PNG
- Subscribe to RSS Feed
- Mark as New
- Mark as Read
- Bookmark
- Subscribe
- Printer Friendly Page
- Report Inappropriate Content
gauge chart.PNG
- Mark as New
- Bookmark
- Subscribe
- Mute
- Subscribe to RSS Feed
- Permalink
- Report Inappropriate Content
gauge chart.PNG
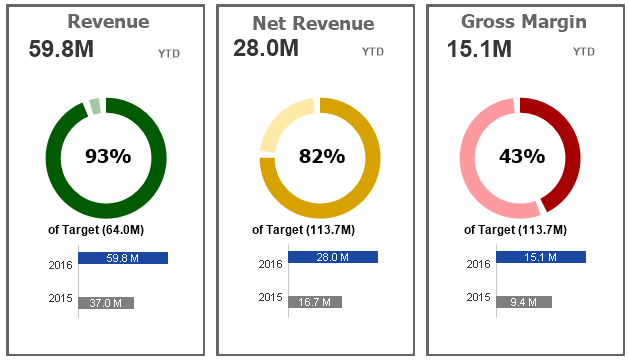
A simple, intuitive, appealing BI visualization, utilizing gauge chart with gaps and horizontal bar charts.
Gauge chart color coding indicates secondary visual/color based metric.
Metrics Displayed:
KPI being measured - top left.
Time period (YTD/QTD/MTD) - top right.
Gauge chart with % achieved compared to Target.
Gauge chart color coded to indicate secondary target measurement.
Ex: Green - % target >= 75%
Yellow - % target >= 50 %
Red - % target < 50%
Target.
Current / Previous year comparison
Gerry.
- Mark as Read
- Mark as New
- Bookmark
- Permalink
- Report Inappropriate Content
Great appealing BI visualization, kindly share qvw file.
Regards,
Zain.
- Mark as Read
- Mark as New
- Bookmark
- Permalink
- Report Inappropriate Content
Good, but can you share the qvw file?
- Mark as Read
- Mark as New
- Bookmark
- Permalink
- Report Inappropriate Content
good representation. could you share the application ?
- Mark as Read
- Mark as New
- Bookmark
- Permalink
- Report Inappropriate Content
Ya Garry, It will be very helpful if you share qvw 
- Mark as Read
- Mark as New
- Bookmark
- Permalink
- Report Inappropriate Content
Nice visual appeal. As others requested, please post your QVW as well for the benefit of others!
- Mark as Read
- Mark as New
- Bookmark
- Permalink
- Report Inappropriate Content
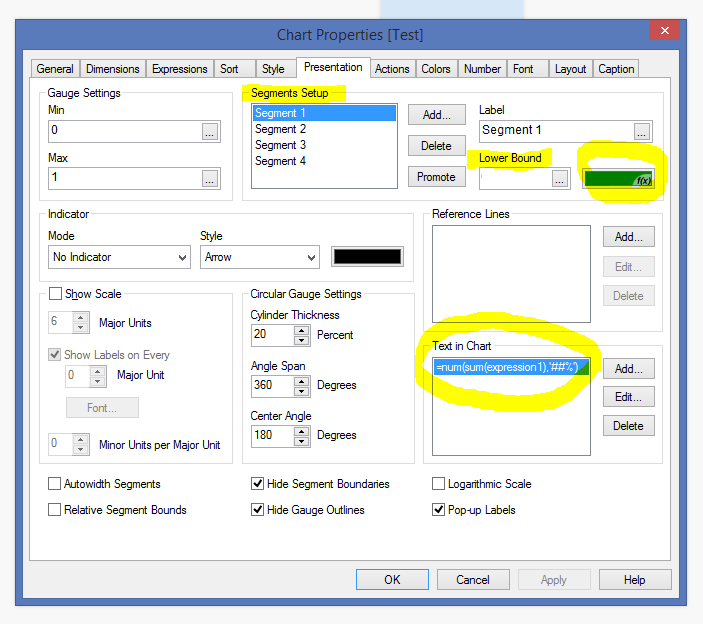
Attached above in the resource library.
A simple object with a few twists that make it cool ! 
The rest are text objects and horizontal bar chart.
Also indicated here, how to set it up.
Thanks to mphekin12 who showed me this ...
- Mark as Read
- Mark as New
- Bookmark
- Permalink
- Report Inappropriate Content
The charts look awesome Gerry!
- Mark as Read
- Mark as New
- Bookmark
- Permalink
- Report Inappropriate Content
another version of the gauge charts with more code and color variation.
- Mark as Read
- Mark as New
- Bookmark
- Permalink
- Report Inappropriate Content
My business in only 1 year old.
I want to show the the gauge to compare between the actual sales this year to the target.
Let say I had 2.3M and the target was 3M.
How do I do that?
Thank you