Unlock a world of possibilities! Login now and discover the exclusive benefits awaiting you.
- Qlik Community
- :
- All Forums
- :
- QlikView Integrations
- :
- Re: Google Maps - Cluster
- Subscribe to RSS Feed
- Mark Topic as New
- Mark Topic as Read
- Float this Topic for Current User
- Bookmark
- Subscribe
- Mute
- Printer Friendly Page
- Mark as New
- Bookmark
- Subscribe
- Mute
- Subscribe to RSS Feed
- Permalink
- Report Inappropriate Content
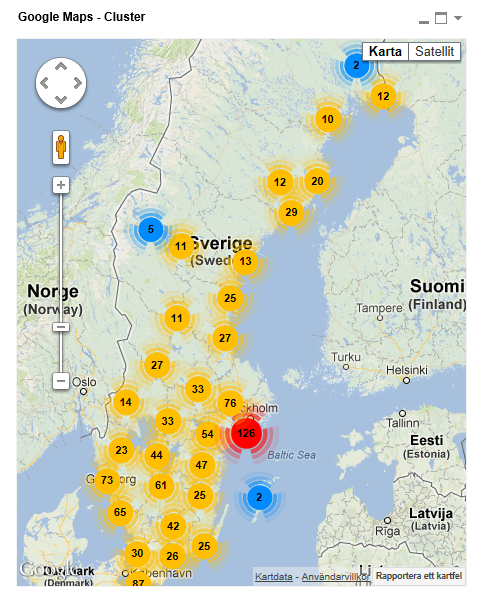
Google Maps - Cluster
Google Maps Extension with Cluster support.
QlikTech takes no responsibility for any code and QlikTech Support Agreement does not cover issues with this extension.
Please review Googles license agreement before you put this into production.
Introduction
This is a QlikView extension object that integrates Google Maps Javascript API V3 and a third party library called MarkerClusterPlus into QlikView.
Load a set a coordinates into QlikView and visualize them together with this extension. The clustering feature is create when you have alot of data points and needs to group/cluster them together for greater visability and performance.
The maxzoom property defines at what zoom level you want your markers clustered. The grid size property controls how big or small cluster grid size you want.
You can either use the extension 'as is' or use it as a base to further customize it to fit your needs.
Download the extension and view source code at: https://github.com/mindspank/GoogleMaps-Cluster-QV11
If you build something awesome please share it with the community!
Live long and prosper.
2015-02-15
Removed download from post, please grab the latest version from Github instead.
2014-02-03
Various fixes.
2014-01-09
There has been numerous upgrades to the extension.
Now clusters now display the value of your expression and with added support to include more information in pop-up labels.
Example grayscale styled map included.
Possibility to show only a single cluster icon style if you do not want it to scale according to the number of markers in the cluster.
2013-06-17
Added custom marker support. Now you can specify a url for an custom marker. Accepts all major image file types.
- Mark as New
- Bookmark
- Subscribe
- Mute
- Subscribe to RSS Feed
- Permalink
- Report Inappropriate Content
Hi,
Has anyone ever worked on a Google Charts - Geo Chart Extension?
I found this one around but I'm having a hard time trying to make it interactive by adding a listener to it so it filters the data based on the selected area.
I can't reference the 'this' object from the dynamically generated function 'drawRegionsMap()' on the Script.js file, I also noticed that some other extensions like the one that uses google maps doesn't build that function nor append it as a script to the document in runtime, so I tried to approach a new version of the extension based on that, but I just got an error where the 'google' object is undefined.
Am I missing something?
- Mark as New
- Bookmark
- Subscribe
- Mute
- Subscribe to RSS Feed
- Permalink
- Report Inappropriate Content
Hello....
I have a problem with Windows Server 2012, Qlikview 11.20 SR5 and Google Maps Cluster Extensions.
I installed the extension and I created the map object, but the object is always empty.
I set the Web mode and I uploaded a xls file with the cities and their latitudes and longitudes.
Why not work?
Thank you
Cristian
- Mark as New
- Bookmark
- Subscribe
- Mute
- Subscribe to RSS Feed
- Permalink
- Report Inappropriate Content
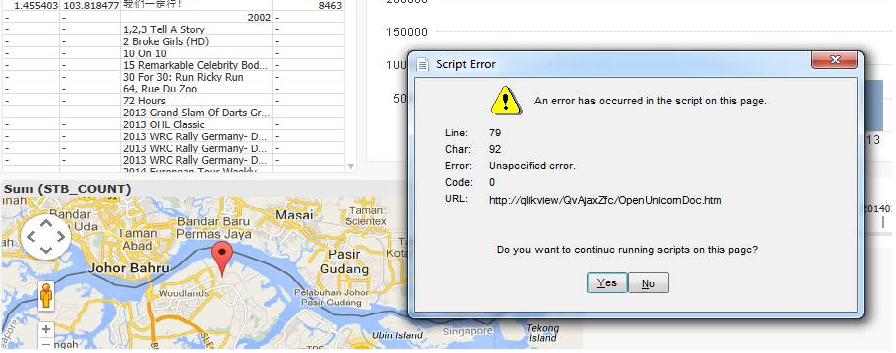
Hi,
I am new to Qlikview and I can test the Google map but there is an error keeps coming out. Anyone has any idea what is this error and how to solve? Thank you all!
- Mark as New
- Bookmark
- Subscribe
- Mute
- Subscribe to RSS Feed
- Permalink
- Report Inappropriate Content
Hi Alexander,
Can you please tell me how to do the following tooltip adjustment using the maps cluster extension that you have uploaded
1) How to increase the popup windows size to adjust as much info as we have put it in there...I mean do not bring the scrollbar and increase the window instead
2) If we are to use scrollbar, how can we drag the scroll down to see more info. In my case as soon as I put my mouse over the scrollbar, the popup disappears.
Many Thanks
Syed
- Mark as New
- Bookmark
- Subscribe
- Mute
- Subscribe to RSS Feed
- Permalink
- Report Inappropriate Content
Hi Alex,
I'm using QV 11 SR5 64-bit edition and IE8.
When I'm trying to open the QV application in webview mode, its showing nothing.
When I create a Scatter Chart bubbles are popping up but no map is showing.
Please help.
Regards.
PS
- Mark as New
- Bookmark
- Subscribe
- Mute
- Subscribe to RSS Feed
- Permalink
- Report Inappropriate Content
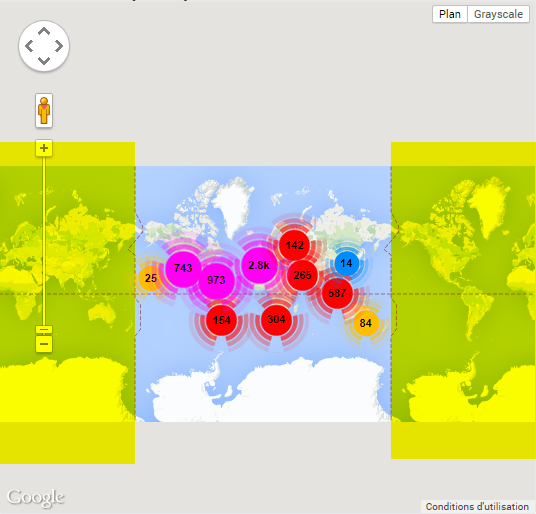
Hi Alexander,
When you have one area to show that's perfect.
I just have troubles when I want to show data on the whole planet.
The initial zoom level shows me twice the map (repeated continents in yellow, like on the attached file).
Is there a way to show only once the continents when opening and refreshing ?
Thanks.
- Mark as New
- Bookmark
- Subscribe
- Mute
- Subscribe to RSS Feed
- Permalink
- Report Inappropriate Content
By default Google Maps have a infinity horizontal scroll, the Earth is round after all.
You could modify the max zoom property of the maps to have it zoom it closer each time. Then the continents wont be in view atleast.
See:
Google Maps Javascript API V3 Reference - Google Maps JavaScript API v3 — Google Developers
In the script.js file, add the property to the options literal at line 115.
- Mark as New
- Bookmark
- Subscribe
- Mute
- Subscribe to RSS Feed
- Permalink
- Report Inappropriate Content
Do you know how to settle this error? just asking again in case you missed the post.
- Mark as New
- Bookmark
- Subscribe
- Mute
- Subscribe to RSS Feed
- Permalink
- Report Inappropriate Content
Hi everyone,
Can someone help me?
When I open this file, and try to open de web view, and create an object, appears a script error, and I can't create nothing more.
What should I do?
- Mark as New
- Bookmark
- Subscribe
- Mute
- Subscribe to RSS Feed
- Permalink
- Report Inappropriate Content
Hello Alexander,
The extension seems to work fine. Great job!
However, I would like to have the Satellite option instead of the Grayscale.
How can I manage this?
Kind regards,
Philippe