Unlock a world of possibilities! Login now and discover the exclusive benefits awaiting you.
- Qlik Community
- :
- All Forums
- :
- QlikView Integrations
- :
- Re: New QlikView Mapping Extensions on QlikMarket
- Subscribe to RSS Feed
- Mark Topic as New
- Mark Topic as Read
- Float this Topic for Current User
- Bookmark
- Subscribe
- Mute
- Printer Friendly Page
- Mark as New
- Bookmark
- Subscribe
- Mute
- Subscribe to RSS Feed
- Permalink
- Report Inappropriate Content
New QlikView Mapping Extensions on QlikMarket
EDIT: These extensions are no longer maintained on QlikMarket since that is not an appropriate place for free and unsupported extensions. I've modified the links below to point to the github repositories where I now keep them. Also, since they're now hosted on github, feel free to make contributions to the code.
Hi everyone,
The demand for mapping in QlikView seems to be a hot topic these days, so I’ve put together two extensions that are now available on QlikMarket bearing the QlikView name.
The first one is an extension which uses SVG images to connect to the data and color and shade the regions in that image:
brianwmunz/svgReader-QV11 · GitHub
Similar to this map of US Counties:
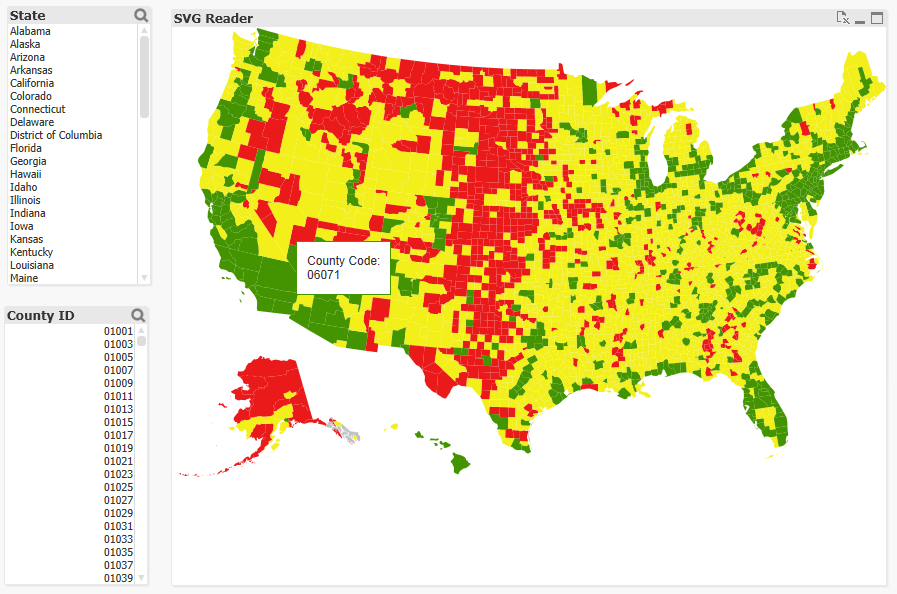
There’s no geospatial connection here (long/lat points can’t be plotted, etc.), but it should prove useful for a lot of simple needs and uses for visualization of a geographical entity. It comes prepackaged with 35 or so maps of countries, etc. and also offers the ability to load in your own custom SVGs for things like floor plans, seating charts, etc.
The second extension is a simple geospatial mapping extension similar to the Google Maps and various other extensions you might have seen in community:
brianwmunz/QuickMap-QV11 · GitHub
This extension simply takes geographic data (longitude/latitude points) from QlikView and draws it over a map. It supports the drawing of dots, lines, or polygon shapes. For example:
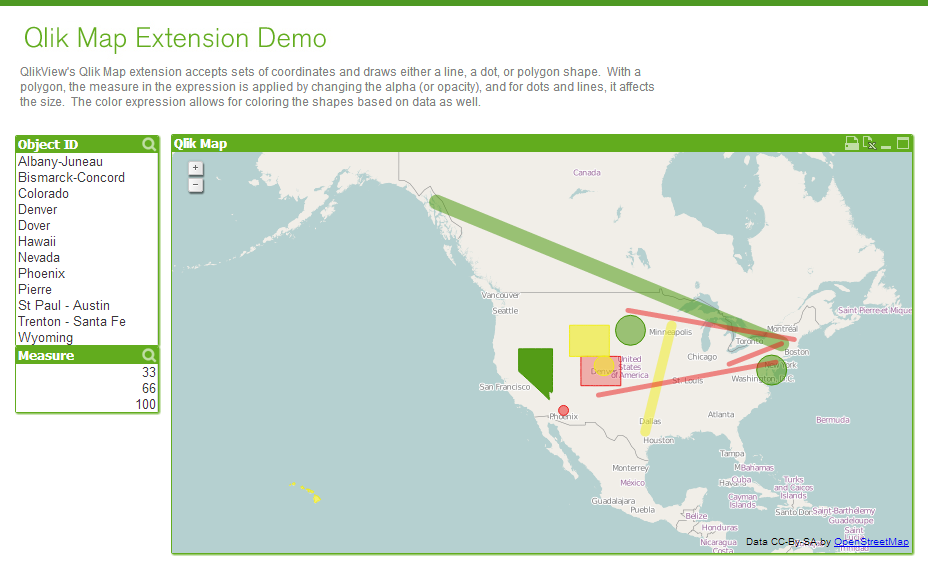
This doesn’t offer near the capabilities of a server based geospatial mapping solution like ESRI, GeoQlik, Idevio, etc. simply because it’s not server side, but it should be helpful for less heavy and complex mapping needs.
Anyway, I hear a lot about need for mapping so I thought I’d let everyone know.
- Mark as New
- Bookmark
- Subscribe
- Mute
- Subscribe to RSS Feed
- Permalink
- Report Inappropriate Content
Hi,
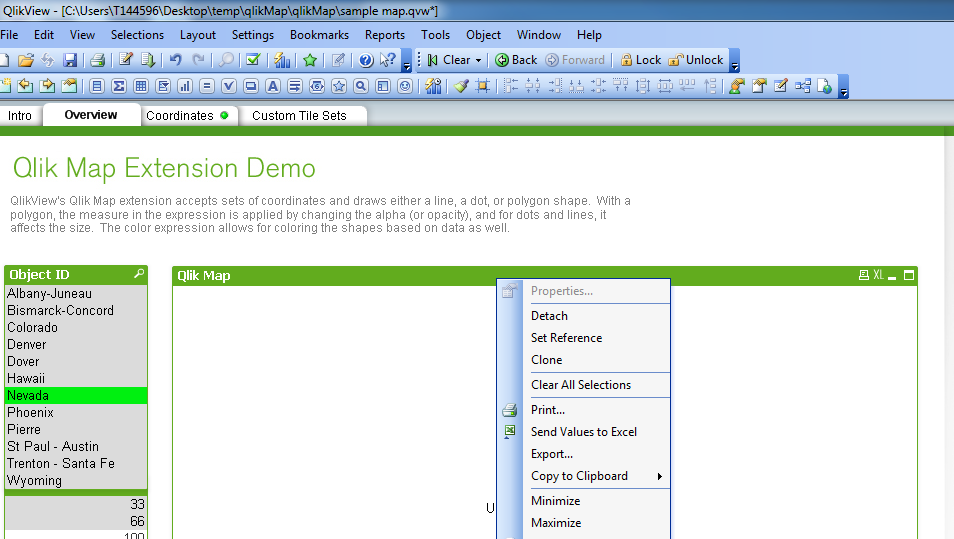
I tried to implement this for my client. But its not working for me . i have downloaded qlikmap folder and was successfully able to install qlikmap.qar file but when i open the qvw file, its not showing the map as "Unknown charttype" and chart properties menu is disabled.
Could anyone suggest what did i miss here. I have attached the screenshot.
- Mark as New
- Bookmark
- Subscribe
- Mute
- Subscribe to RSS Feed
- Permalink
- Report Inappropriate Content
Hi,
You need to run QlikView in webview for extensions to work.
- Mark as New
- Bookmark
- Subscribe
- Mute
- Subscribe to RSS Feed
- Permalink
- Report Inappropriate Content
Hi,
I really like the svg map plugin and thanks for putting it up. I have installed it on my desktop
and got it to work fine with an app I am working on. However, when I access the
same app via the access point I am seeing some wacky shading (states disappear, selections
are not highlighted). Have you come across this or know what could be the
reason?
Thanks!
- Mark as New
- Bookmark
- Subscribe
- Mute
- Subscribe to RSS Feed
- Permalink
- Report Inappropriate Content
Brian,
Is there any update on the error resolution. Today I downloaded latest version from QlikMarket. But still I am also getting same error. I am using QV10 SR1.
- Mark as New
- Bookmark
- Subscribe
- Mute
- Subscribe to RSS Feed
- Permalink
- Report Inappropriate Content
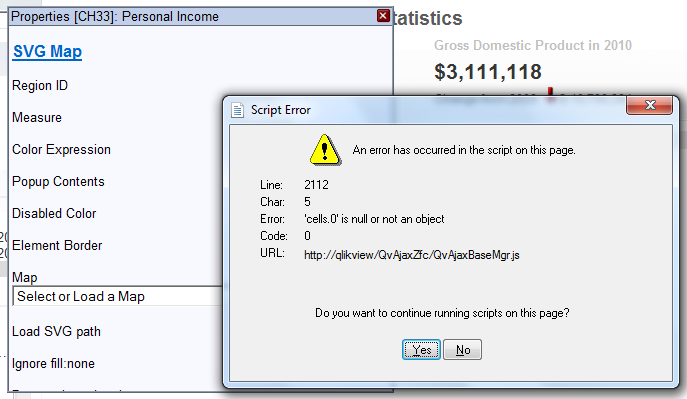
Hey Brian,
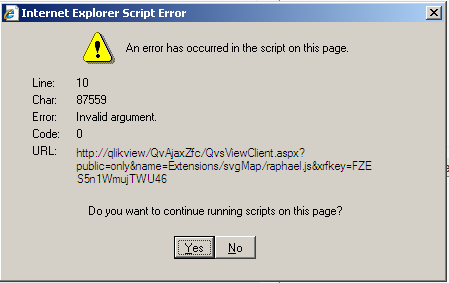
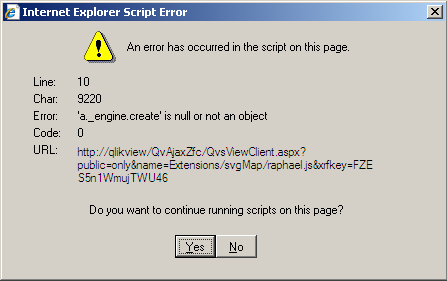
I am getting the errors while as shown in the images whil using SVG extensions.
Please suggest me how to fix.
Regards
Sahil
- Mark as New
- Bookmark
- Subscribe
- Mute
- Subscribe to RSS Feed
- Permalink
- Report Inappropriate Content
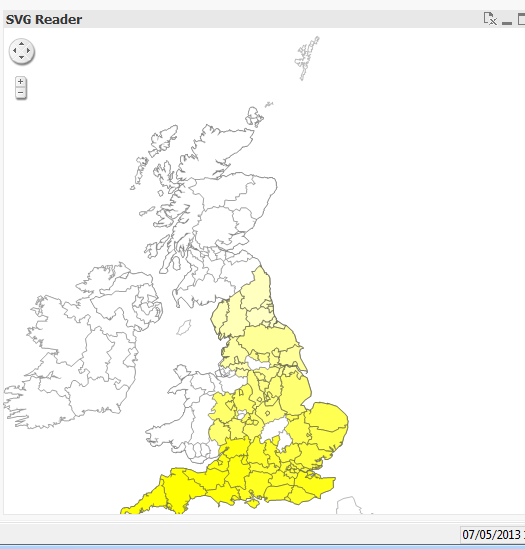
Hi,
Similar to Igo, I am trying to map the English counties down to local authority level, but like Sahilviz, I get the same line 10 char 87559 error message. I have taken the list of NUTS 3 codes from http://en.wikipedia.org/wiki/NUTS_of_the_United_Kingdom#NUTS_codes, however I find that some of the areas in England are missing (as seen in the attached picture there are white regions in the middle).Three questions:
1) How can I fix the error relating to line 10 charr 87559 or when will someone else be able to fix it? I am most definilty a novice to this area and have not got much experience with script coding.
2) Missing codes: any ideas for how I can get the codes for the regions that I seem to be missing? Igo, do you have a list of NUT3 codes that you are using and I could compare to? I have 99 NUTS 3 codes relating to England, or 139 NUTS 3 that relate to all of the UK.
3) The programme runs REALLY slowly and often does not show the map unless I close it down and re-open it. Any suggestions for how to make it perform better/faster?
Thank you,
Isabel
- Mark as New
- Bookmark
- Subscribe
- Mute
- Subscribe to RSS Feed
- Permalink
- Report Inappropriate Content
These are free extensions.
- Mark as New
- Bookmark
- Subscribe
- Mute
- Subscribe to RSS Feed
- Permalink
- Report Inappropriate Content
Ok, so a lot of stuff going on here 
One of the main reasons this extension is not supported is because so many things can go wrong or be confusing with SVGs. All the stars need to align for custom SVGs to be loaded in in terms of data and SVG image.
That being said...
1) This error doesn't necessarily mean that there's a problem in the script. It could be that the region ID you're passing in is confusing the extension. Do you have duplicates in your IDs? That is, a given region may be listed in more than one row? A good rule of thumb with extensions in general is to create a straight table that exactly mimics the properties of the extension. If you do this, you'll be able to see what the data coming into the extension looks like.
2) I'm not sure where jgo found this map, so I'll let him address this.
3) performance can be based on many things. Again, I'd suggest creating a straight table to look at your data. The data should come in as one row per region. So if you're looking at the 50 states, for example, 50 rows of data should come in. So, I'd check to make sure your data is right. Also, size of the SVG can be an issue, and if I'm correct, the SVG jgo attached above is 510k. This isn't TOO bad to load and once it's loaded the first time, it shold be cached, BUT a lot depends on the browser. If you have IE7 installed on your machine, this is going to run slowly no matter what. If you're running this off a server and use something like chrome, it's going to be lightyears faster.
- Mark as New
- Bookmark
- Subscribe
- Mute
- Subscribe to RSS Feed
- Permalink
- Report Inappropriate Content
Lol - JGO is a girl, but I am happy to help out if I can - Isabel, if you want to send me your svg file, I'll have a look behind the scenes - I managed to get a ceremonial counties of England SVG working - although I had to change the 'label's of the counties - I then had to get a working breakdown of relevant counties. Unfortunately in the UK, we have lots of variance on what a county actually is (Unitary authority, city etc..), or whether it is or isn't in existence, i.e. Avon. Anyway, I'm getting quite expert at working through these at the moment! I can also see if I get the error code in my environment. Generally I've tended to find that if it doesn't show (i.e. in white), then you are missing the two bits of data (county in the data set, and county in the SVG), or they aren't linking up correctly.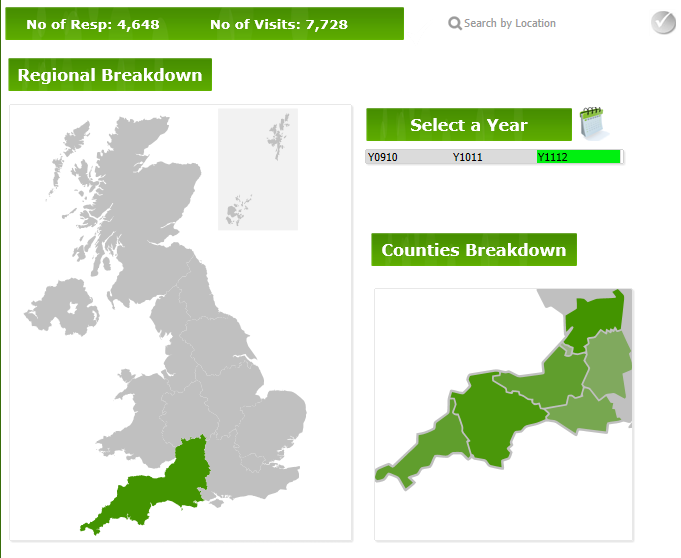
Cheers,
Julie 😉
- Mark as New
- Bookmark
- Subscribe
- Mute
- Subscribe to RSS Feed
- Permalink
- Report Inappropriate Content
HA! I'm sorry, Julie. Not only are you a girl, I know you. Sorry.