Unlock a world of possibilities! Login now and discover the exclusive benefits awaiting you.
- Qlik Community
- :
- All Forums
- :
- QlikView Integrations
- :
- Re: New QlikView Mapping Extensions on QlikMarket
- Subscribe to RSS Feed
- Mark Topic as New
- Mark Topic as Read
- Float this Topic for Current User
- Bookmark
- Subscribe
- Mute
- Printer Friendly Page
- Mark as New
- Bookmark
- Subscribe
- Mute
- Subscribe to RSS Feed
- Permalink
- Report Inappropriate Content
New QlikView Mapping Extensions on QlikMarket
EDIT: These extensions are no longer maintained on QlikMarket since that is not an appropriate place for free and unsupported extensions. I've modified the links below to point to the github repositories where I now keep them. Also, since they're now hosted on github, feel free to make contributions to the code.
Hi everyone,
The demand for mapping in QlikView seems to be a hot topic these days, so I’ve put together two extensions that are now available on QlikMarket bearing the QlikView name.
The first one is an extension which uses SVG images to connect to the data and color and shade the regions in that image:
brianwmunz/svgReader-QV11 · GitHub
Similar to this map of US Counties:
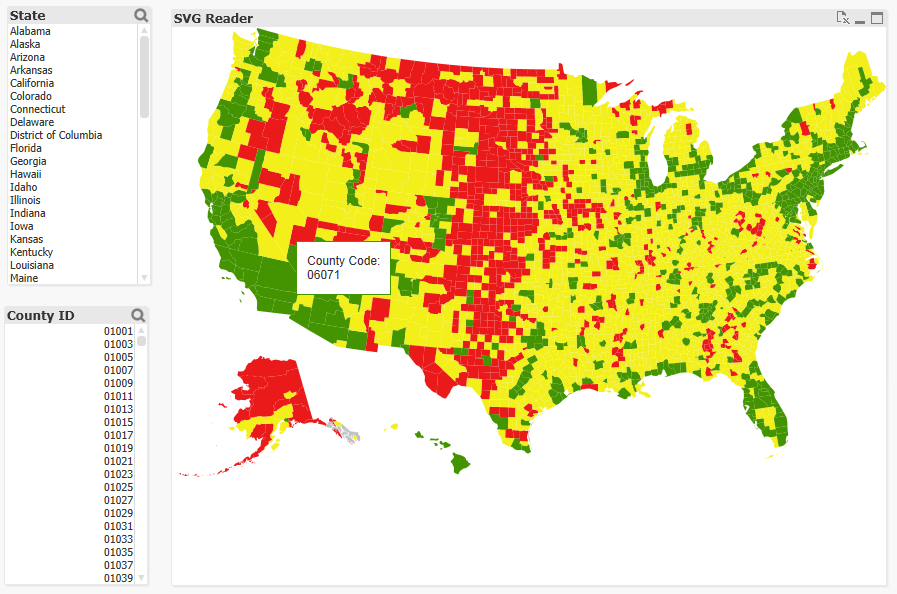
There’s no geospatial connection here (long/lat points can’t be plotted, etc.), but it should prove useful for a lot of simple needs and uses for visualization of a geographical entity. It comes prepackaged with 35 or so maps of countries, etc. and also offers the ability to load in your own custom SVGs for things like floor plans, seating charts, etc.
The second extension is a simple geospatial mapping extension similar to the Google Maps and various other extensions you might have seen in community:
brianwmunz/QuickMap-QV11 · GitHub
This extension simply takes geographic data (longitude/latitude points) from QlikView and draws it over a map. It supports the drawing of dots, lines, or polygon shapes. For example:
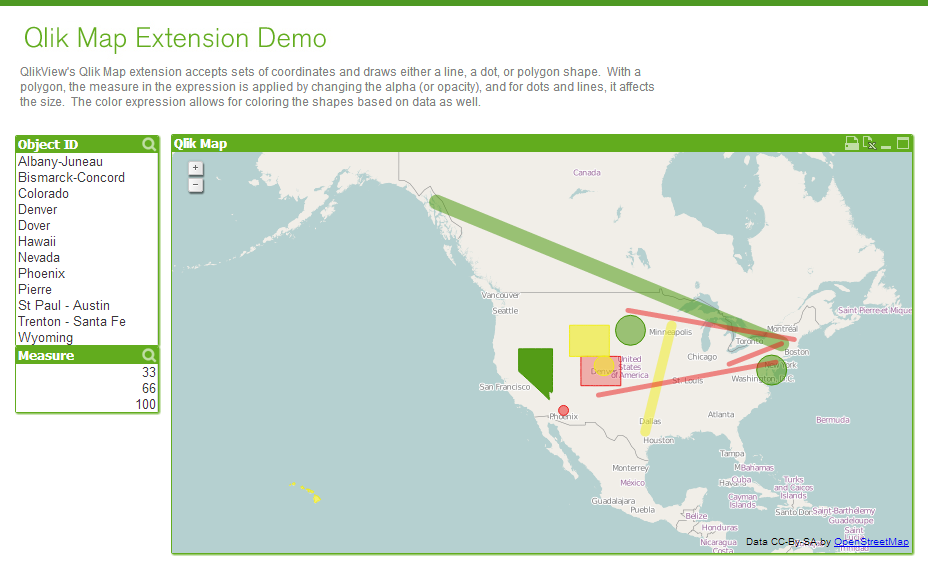
This doesn’t offer near the capabilities of a server based geospatial mapping solution like ESRI, GeoQlik, Idevio, etc. simply because it’s not server side, but it should be helpful for less heavy and complex mapping needs.
Anyway, I hear a lot about need for mapping so I thought I’d let everyone know.
- Mark as New
- Bookmark
- Subscribe
- Mute
- Subscribe to RSS Feed
- Permalink
- Report Inappropriate Content
😉
- Mark as New
- Bookmark
- Subscribe
- Mute
- Subscribe to RSS Feed
- Permalink
- Report Inappropriate Content
Thanks Brian ! As per your Point 1) My data has multiple rows for same regions. I will try to make it unique and test then.
Also , Can you guide me in attaing the below mentioned objective :
1) Customize USA County SVG map ( which is standard and appears in the extension itself) to club multiple Counties to Regions as shown below :
| County | Region |
| LOS ANGELES | A |
| ORANGE | A |
| VENTURA | B |
| SAN BERNARDINO | B |
| RIVERSIDE | C |
| SAN DIEGO | D |
I want to show these two levels of regions in the map. Please guide me ! Thanks 
Sahil
- Mark as New
- Bookmark
- Subscribe
- Mute
- Subscribe to RSS Feed
- Permalink
- Report Inappropriate Content
Thanks guys,
I did have multiple rows of data for each area, but I presume that this can be overcome by loading the mapping in a table, and the using a matching ID to link it to other data that will be on multiple lines.
I did not actually create an SVG file because I simply selected the UK option as this implied it was at NUTS 3 level.
I'm now using OpenLayers as a coleauge of mine created an KML file for all the local authorities in England and this is exactly what I required. I have not changed any of the KML and so it has been really easy to use and have had no other issues with it - looks like a good solution!
Thanks again for your responses,
Isabel
- Mark as New
- Bookmark
- Subscribe
- Mute
- Subscribe to RSS Feed
- Permalink
- Report Inappropriate Content
I'll have another look at the SVG, however is there any chance you can share the KML file for Openlayers? I have a PostCode file for KML, but not a Local Authority one and that would be really useful.
- Mark as New
- Bookmark
- Subscribe
- Mute
- Subscribe to RSS Feed
- Permalink
- Report Inappropriate Content
Hi Brian,
Please give me the link to download this extension. I actually tried a lot but couldn't find it.
Regards
Sagar Gupta
- Mark as New
- Bookmark
- Subscribe
- Mute
- Subscribe to RSS Feed
- Permalink
- Report Inappropriate Content
Hi Brian,
I would like to use svgMap but it doesn't show anything (except controls) in WebView on v11.2 IR or v11.2 SR2 with IE 9 or IE 10. How to go further with it? However, the SVG map on the apps on the demo site is working for me.
- Ralf
- Mark as New
- Bookmark
- Subscribe
- Mute
- Subscribe to RSS Feed
- Permalink
- Report Inappropriate Content
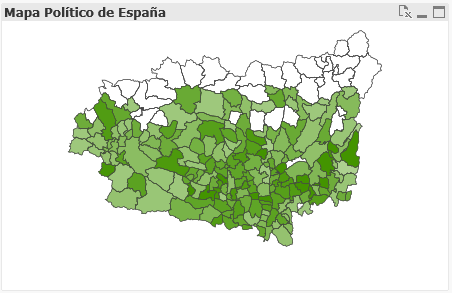
Brian, I work with v11.2 SR2 and IE 9 and it works fine.
The only I have to do is include the correct Id's in the dimension I use for each map. For example, the map about Spain needs to work with provinces and their ISO Code.
| Province | CodeProvName |
|---|---|
| ES-A | Alicante |
| ES-AB | Albacete |
| ES-AL | Almeria |
| ES-AV | Avila |
| ES-B | Barcelona |
| ES-BA | Badajoz |
| ES-BI | Vizcaya... |
- Mark as New
- Bookmark
- Subscribe
- Mute
- Subscribe to RSS Feed
- Permalink
- Report Inappropriate Content
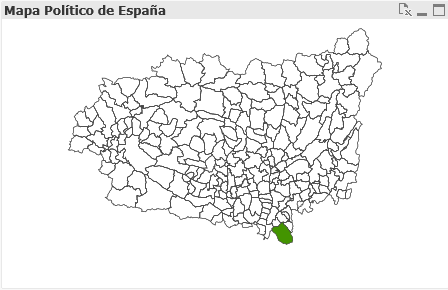
Unfortunately I've another kind of issues, rendering the images.
When I make selections sometimes the images shown are not rendered correctly, for example,
in the image below I should see only one municipality, but the image are not well rendered until I click Ctrl+F5.
Could you help to improve this?
- Mark as New
- Bookmark
- Subscribe
- Mute
- Subscribe to RSS Feed
- Permalink
- Report Inappropriate Content
I have ie10 with 11.20 SR2 and the same problem!
- Mark as New
- Bookmark
- Subscribe
- Mute
- Subscribe to RSS Feed
- Permalink
- Report Inappropriate Content
I also have ie10 with 11.20 SR2 and the same problem!