Unlock a world of possibilities! Login now and discover the exclusive benefits awaiting you.
- Qlik Community
- :
- All Forums
- :
- QlikView Integrations
- :
- Re: New QlikView Mapping Extensions on QlikMarket
- Subscribe to RSS Feed
- Mark Topic as New
- Mark Topic as Read
- Float this Topic for Current User
- Bookmark
- Subscribe
- Mute
- Printer Friendly Page
- Mark as New
- Bookmark
- Subscribe
- Mute
- Subscribe to RSS Feed
- Permalink
- Report Inappropriate Content
New QlikView Mapping Extensions on QlikMarket
EDIT: These extensions are no longer maintained on QlikMarket since that is not an appropriate place for free and unsupported extensions. I've modified the links below to point to the github repositories where I now keep them. Also, since they're now hosted on github, feel free to make contributions to the code.
Hi everyone,
The demand for mapping in QlikView seems to be a hot topic these days, so I’ve put together two extensions that are now available on QlikMarket bearing the QlikView name.
The first one is an extension which uses SVG images to connect to the data and color and shade the regions in that image:
brianwmunz/svgReader-QV11 · GitHub
Similar to this map of US Counties:
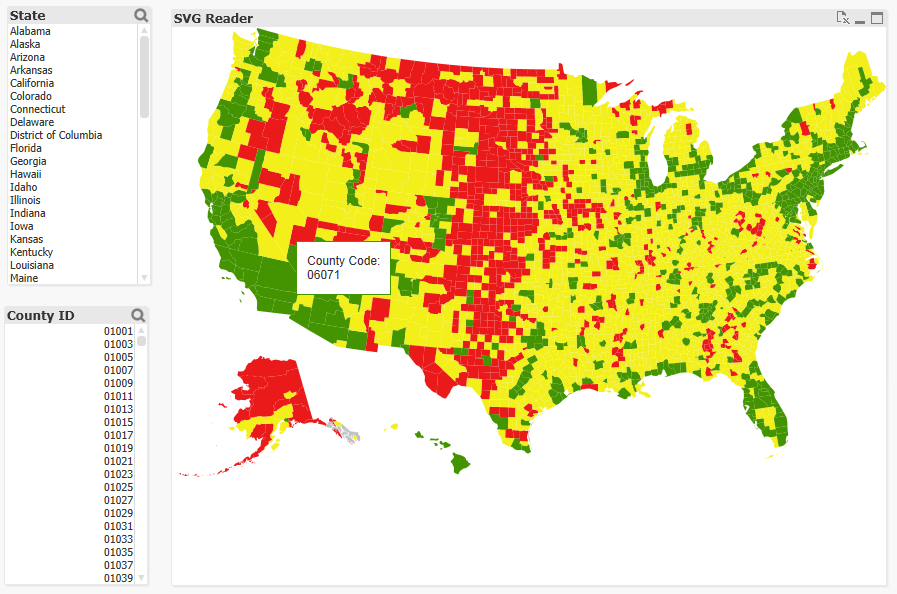
There’s no geospatial connection here (long/lat points can’t be plotted, etc.), but it should prove useful for a lot of simple needs and uses for visualization of a geographical entity. It comes prepackaged with 35 or so maps of countries, etc. and also offers the ability to load in your own custom SVGs for things like floor plans, seating charts, etc.
The second extension is a simple geospatial mapping extension similar to the Google Maps and various other extensions you might have seen in community:
brianwmunz/QuickMap-QV11 · GitHub
This extension simply takes geographic data (longitude/latitude points) from QlikView and draws it over a map. It supports the drawing of dots, lines, or polygon shapes. For example:
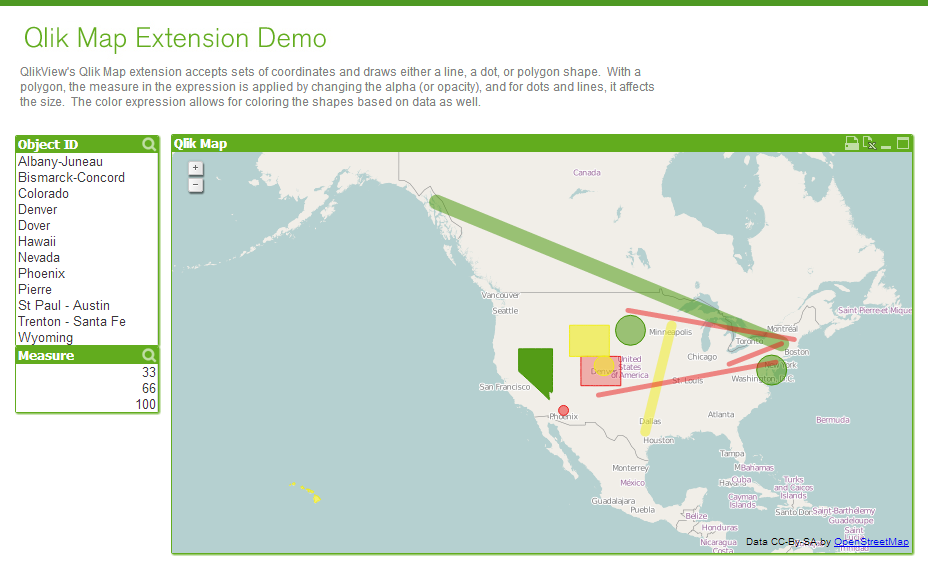
This doesn’t offer near the capabilities of a server based geospatial mapping solution like ESRI, GeoQlik, Idevio, etc. simply because it’s not server side, but it should be helpful for less heavy and complex mapping needs.
Anyway, I hear a lot about need for mapping so I thought I’d let everyone know.
- Mark as New
- Bookmark
- Subscribe
- Mute
- Subscribe to RSS Feed
- Permalink
- Report Inappropriate Content
Hi Brian,
Great extension! 
I've found a bug in the map o France. 57th department's ID is path 203 instead of FR-57.
Bye!
- Mark as New
- Bookmark
- Subscribe
- Mute
- Subscribe to RSS Feed
- Permalink
- Report Inappropriate Content
I have coordinates in EPSG:3006, how do I plot theese in this extension?
- Mark as New
- Bookmark
- Subscribe
- Mute
- Subscribe to RSS Feed
- Permalink
- Report Inappropriate Content
Hi Brian
First thanks for nice extension.
When I open a map in Web View it shows nothing - just white background. I am on 11.2 SP5 and extension 1.10
Also is it possible to enable functionality, that when I select a region, it zooms in, but all the surrounding regions stays the same colour as they were?
Thanks.
Darius
- Mark as New
- Bookmark
- Subscribe
- Mute
- Subscribe to RSS Feed
- Permalink
- Report Inappropriate Content
Hello Brian,
First, thanks for the great tool! it looks good!
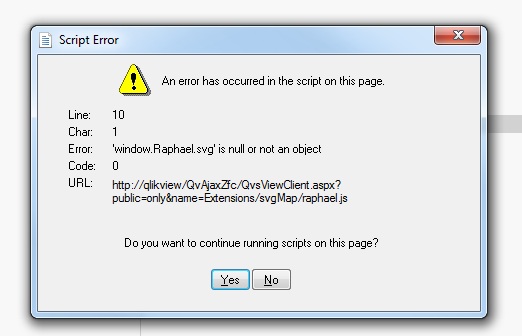
Problem is that i still get an error:
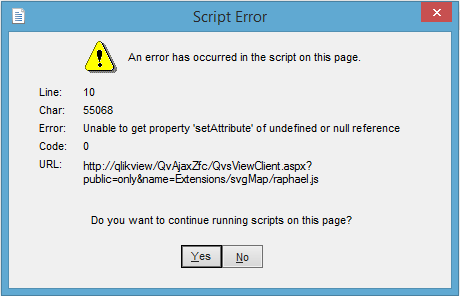
Could you tell me what i'm doing wrong?
Thanks for your time and effort!
- Mark as New
- Bookmark
- Subscribe
- Mute
- Subscribe to RSS Feed
- Permalink
- Report Inappropriate Content
Hola,
No puedo mostrar datos para el mapa de Mexico 
Estoy usando las regiones: MX-AG MX-BC MX-BS MX-CM MX-CS MX-CH MX-CO ... MX-DF
- Mark as New
- Bookmark
- Subscribe
- Mute
- Subscribe to RSS Feed
- Permalink
- Report Inappropriate Content
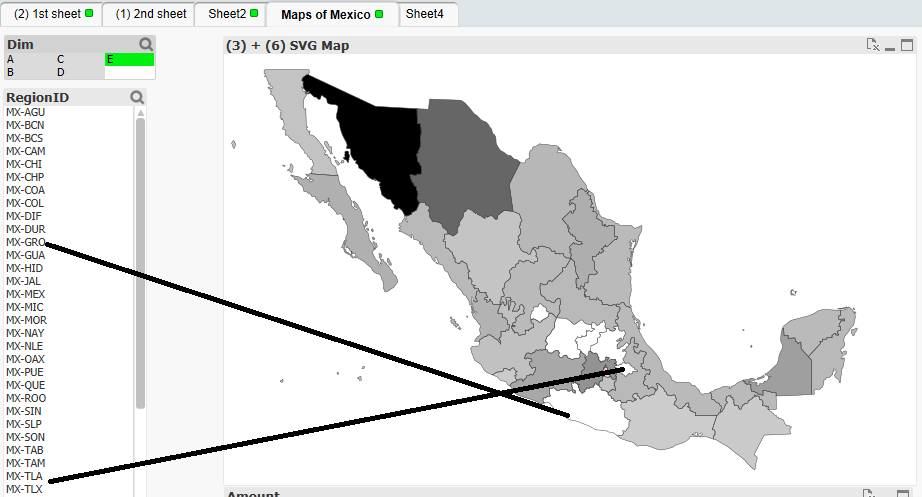
Hello,
The Mexico map to not display the data according to ISO 3166-2: MX, with two digits, shows nothing, with 3, there are several states that are not shown.
As I can do to validate that data?
Can you help please.
Att Victor Ramos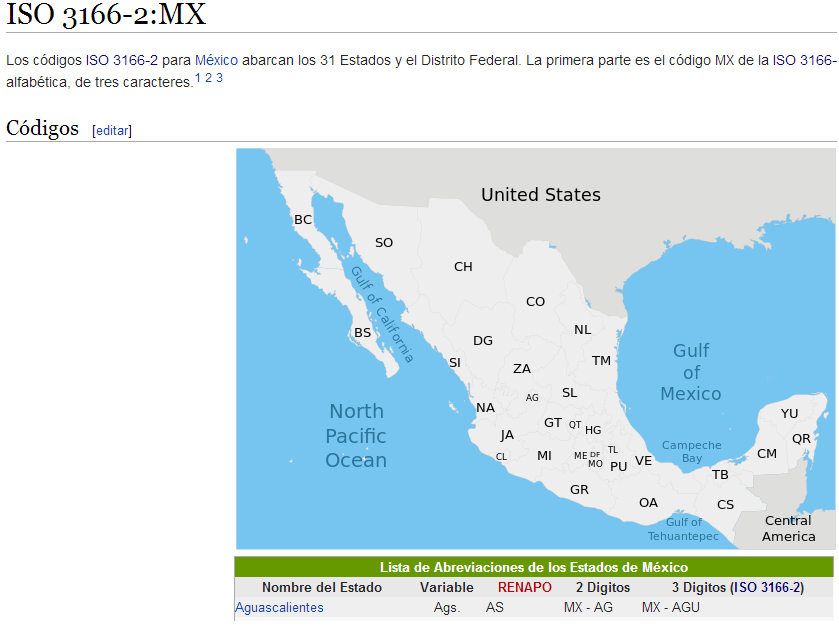
- Mark as New
- Bookmark
- Subscribe
- Mute
- Subscribe to RSS Feed
- Permalink
- Report Inappropriate Content
You can have a look into the Mexico svg file an make corrections to the paths..
- Mark as New
- Bookmark
- Subscribe
- Mute
- Subscribe to RSS Feed
- Permalink
- Report Inappropriate Content
Thanks.
- Mark as New
- Bookmark
- Subscribe
- Mute
- Subscribe to RSS Feed
- Permalink
- Report Inappropriate Content
I am trying to use this extension but as soon as I drag over the SVG Mao I get the following error. Does this have to do with my version of IE?
- Mark as New
- Bookmark
- Subscribe
- Mute
- Subscribe to RSS Feed
- Permalink
- Report Inappropriate Content
This depends...where did you get the extension?
And what version of IE are you running?