Unlock a world of possibilities! Login now and discover the exclusive benefits awaiting you.
- Qlik Community
- :
- All Forums
- :
- QlikView Integrations
- :
- Re: Org Chart version 2
- Subscribe to RSS Feed
- Mark Topic as New
- Mark Topic as Read
- Float this Topic for Current User
- Bookmark
- Subscribe
- Mute
- Printer Friendly Page
- Mark as New
- Bookmark
- Subscribe
- Mute
- Subscribe to RSS Feed
- Permalink
- Report Inappropriate Content
Org Chart version 2
Hi everyone,
I recently helped someone who needed my org chart extension to actually work properly and be less confusing to use (the nerve!).
So, this was a good excuse to quickly update the old org chart extension I built several years ago to make the properties more clear and make the extension more flexible. If I had a lot of time, there's more I'd do, but this should at least be an improvement.
Anyway, I removed all of the properties except for 3:
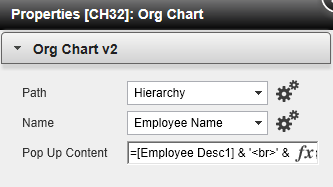
The path is the same as before. It is the hierarchical tree of employees (or whatever you're displaying) separated by dashes. So an employee named Bill Williams whose bosses are Jim Smith and Fred Clark would be "Fred Clark-Jim Smith-Bill Williams." It's a setting you can choose in QlikView to display as a tree.
Name is the name of the empoyee (or whatever you're displaying). This is needed to properly map and reconcile the boxes with the hierarchy.
The pop up content is where you set what you want to show up in the pop up. This is the main improvement. Before what was shown here was specific, but now you can set it to anything. In order to mimic the pop-up from the extensions example demo (http://us.demo.qlik.com/detail.aspx?appName=Extension%20Examples.qvw) you would set this to be:
=[Employee Desc1] & '<br>' & [Employee Desc2]
So, that's it. No huge changes, but it should be an improvement.
The new extension will not overwrite your old one and will appear as "Org Chart v2"
You can download it here:
http://community.qlik.com/docs/DOC-3892
Thanks!
- Mark as New
- Bookmark
- Subscribe
- Mute
- Subscribe to RSS Feed
- Permalink
- Report Inappropriate Content
Brian - you exposed some great possibilities with this extension - In many cases going out to Google is a challenge.
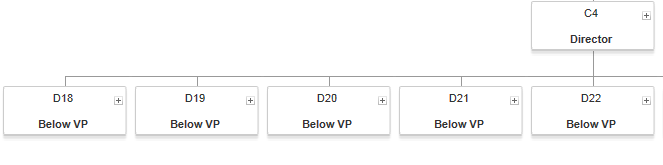
I'm on such a project. We've started playing with the code - and made some improvements - We've added the ability for a box to have 2 lines - say a name and a title underneath. The title line is an expression, not a
Attached is the draft code.
If someone is playing around with the extension - here is our wish list:
The box & the + extension allows for a formula
A formula for the box color
The box and + extension will resize automatically allowing from 1-3 lines.
- Mark as New
- Bookmark
- Subscribe
- Mute
- Subscribe to RSS Feed
- Permalink
- Report Inappropriate Content
What's the line to expand the horizontal width of the box?
- Mark as New
- Bookmark
- Subscribe
- Mute
- Subscribe to RSS Feed
- Permalink
- Report Inappropriate Content
Hi all,
I'm trying to pivot this visualization so that the nodes are positioned vertically rather than horizontal. Can you please point me to the area of the script where i have to make this change? This is to eliminate the horizontal scroll bar.
Thanks for your time.
Regards
V.
- Mark as New
- Bookmark
- Subscribe
- Mute
- Subscribe to RSS Feed
- Permalink
- Report Inappropriate Content
Daniel - I have the same wish list as you mentioned:
The box & the + extension allows for a formula
A formula for the box color
The box and + extension will resize automatically allowing from 1-3 lines.
Have you (or anyone else) done any work on this and would like to share?
- Mark as New
- Bookmark
- Subscribe
- Mute
- Subscribe to RSS Feed
- Permalink
- Report Inappropriate Content
Brian, V. and Rajiv, Sam Pena posted Org Chart 3.0 here... With 3.0 You have better control of the content in the org boxes, use larger organizational objects, and put multiple org charts on a page (say current v. proposed) try it yourself: http://community.qlik.com/docs/DOC-8156
Enjoy,
Daniel
- Mark as New
- Bookmark
- Subscribe
- Mute
- Subscribe to RSS Feed
- Permalink
- Report Inappropriate Content
I've build an app using Org Chart extension, which looks fine on screen, however I'm trying to find a way to print it.
The only option I found was maximizing the object and using the browser's Print option. It doesn't look good, all borders and lines disapear.
Anyone with a better idea for printing?
Or anyone knows another option for building Org Charts? (even if a paid extension)
Thanks,
Rob
- Mark as New
- Bookmark
- Subscribe
- Mute
- Subscribe to RSS Feed
- Permalink
- Report Inappropriate Content
Have you tried a online diagram software like creately. Its a hassle free organizational chart software. Easy to learn and create. Templates, examples and tutorials available for fast diagramming as well. Hope this helps
- Mark as New
- Bookmark
- Subscribe
- Mute
- Subscribe to RSS Feed
- Permalink
- Report Inappropriate Content
Hi, I am new to qlikview and I need you to give a step by step on how to use the orgchart. I have an excel file with the following fields: Parent position ID, Position ID and Employee name, where position ID reports to parent position ID. I don't know how to use Hierarchy in JS.
I appreciate if you could guide me from the start i.e. ...from the source excel file, then load in qlik view, if there is a script that needs to be done..and so on..
I appreciate your help.
Regards,
- Mark as New
- Bookmark
- Subscribe
- Mute
- Subscribe to RSS Feed
- Permalink
- Report Inappropriate Content
Hi Brian, Thanks. Would you mind sending / showing me a step by step process. I tried to use this extension but it shows no hierarchy (path)... do I need to create this field in my source data?,
Would you mind sending me a complete sample i.e the source data, the script that needs to be done, and any other steps that I am not aware of.
My apology for asking too much. As mentioned before, I am very new in qlikview
Regards,
- Mark as New
- Bookmark
- Subscribe
- Mute
- Subscribe to RSS Feed
- Permalink
- Report Inappropriate Content
Hi Brian,
Can you just tell me how to refresh the report each time a selection is made in order to refresh the map in webview mode.My Map box extension is working perfectly but however when a selection is made on a listbox on the same page
map shows nothing/blank.
Thanks