Unlock a world of possibilities! Login now and discover the exclusive benefits awaiting you.
- Qlik Community
- :
- All Forums
- :
- QlikView Integrations
- :
- QlikView and R
- Subscribe to RSS Feed
- Mark Topic as New
- Mark Topic as Read
- Float this Topic for Current User
- Bookmark
- Subscribe
- Mute
- Printer Friendly Page
- Mark as New
- Bookmark
- Subscribe
- Mute
- Subscribe to RSS Feed
- Permalink
- Report Inappropriate Content
QlikView and R
Hi
Has anyone attempted getting QlikView and R talking to eachother?
I would like to do advanced statistical computing in R without having to go via Excel.
Thanks.
Joao.
- « Previous Replies
- Next Replies »
- Mark as New
- Bookmark
- Subscribe
- Mute
- Subscribe to RSS Feed
- Permalink
- Report Inappropriate Content
Hi Andrea,
I first read the total number of the data and then read the result data one by one and it will work. The coding is ugly...
| UU=UBound(RResult) | ||
| msgbox("I received from R : " & UU+1) | ||
| for i=0 to UU | ||
| R.EvaluateNoReturn "outdata<-fit$cluster[" & i+1 & "]" | ||
| RResult=R.GetSymbol("outdata") | ||
| set result=ActiveDocument.DynamicUpdateCommand ("UPDATE * SET new_group=" & RResult & " WHERE ID=" & mySelections(i)) | ||
| next |
- Mark as New
- Bookmark
- Subscribe
- Mute
- Subscribe to RSS Feed
- Permalink
- Report Inappropriate Content
Hi Martin,
Many thanks for your help.
I solved using the below code:
---
For i = 0 To UBound(mySelections)
vCluster = R.Evaluate("QVData[" & (i + 1) & ",4]")
set result = ActiveDocument.DynamicUpdateCommand ("UPDATE * SET FitCluster=" & vCluster & "WHERE [Zip Code]='" & mySelections(i) &"'")
Next
---
However your post is very useful.
Regards
Andrea
- Mark as New
- Bookmark
- Subscribe
- Mute
- Subscribe to RSS Feed
- Permalink
- Report Inappropriate Content
The macro is running fine but whatever the value i'm selecting from the patient id list box and running the 'macro run'
button, values are not reflecting on the text objects. What to do now?
My macro is :
'''''''''''''''''''''''''''''''''''''''''''''''''''''''''''''''''''''''''''''''''''''''''''''''''''''''''''''''''''''''''''''
LOGFILE_NAME = CurrentPath()&"/logs/R.log"
'''''''''''''''''''''''''''''''''''''''''''''''''''''''''''''''''''''''''''''''''''''''''''''''''''''''''''''''''''''''''''''
Sub runRScore
' Export the selected patient data to be scored.
Set myTable=ActiveDocument.GetSheetObject("DataSentToR")
myTable.Export CurrentPath&"/data/ExportFile.csv",",",0
' Create a COM object representing R
Set R = CreateObject("StatConnectorSrv.StatConnector")
R.Init "R"
' Rattle is Copyright (c) 2006-2012 Togaware Pty Ltd.
R.EvaluateNoReturn "library(rattle)"
R.EvaluateNoReturn "building <- TRUE"
R.EvaluateNoReturn "scoring <- ! building"
' The colorspace package is used to generate the colours used in plots, if available.
R.EvaluateNoReturn "library(colorspace)"
' A pre-defined value is used to reset the random seed so that results are repeatable.
R.EvaluateNoReturn "crv$seed <- 42"
' Load the data.
R.EvaluateNoReturn "crs$dataset <- read.csv('"&CurrentPath&"/data/readmission.csv', na.strings=c('.', 'NA', '', '?'), strip.white=TRUE, encoding='UTF-8')"
' The following variable selections have been noted.
R.EvaluateNoReturn "crs$input <- c('enum', 't.start', 't.stop', 'time','event', 'chemo', 'sex', 'dukes','charlson')"
R.EvaluateNoReturn "crs$numeric <- c('enum', 't.start', 't.stop', 'time','event')"
R.EvaluateNoReturn "crs$categoric <- c('chemo', 'sex', 'dukes', 'charlson')"
R.EvaluateNoReturn "crs$target <- 'death'"
R.EvaluateNoReturn "crs$risk <- NULL"
R.EvaluateNoReturn "crs$ident <- c('record', 'id')"
R.EvaluateNoReturn "crs$ignore <- NULL"
R.EvaluateNoReturn "crs$weights <- NULL"
' Decision Tree
' The 'rpart' package provides the 'rpart' function.
R.EvaluateNoReturn "require(rpart, quietly=TRUE)"
' Reset the random number seed to obtain the same results each time.
R.EvaluateNoReturn "set.seed(crv$seed)"
' Build the Decision Tree model.
R.EvaluateNoReturn "crs$rpart <- rpart(death ~ ., data=crs$dataset[, c(crs$input, crs$target)], method='class', parms=list(split='information'), control=rpart.control(usesurrogate=0, maxsurrogate=0))"
' Score a dataset.
' Read a dataset from file for testing the model.
R.EvaluateNoReturn "crs$testset <- read.csv('"&CurrentPath&"/data/ExportFile.csv', na.strings=c('.', 'NA', '', '?'), header=TRUE, sep=',', encoding='UTF-8')"
' Obtain probability scores for the Decision Tree model on ExportFile.csv.
R.EvaluateNoReturn "crs$pr <- predict(crs$rpart, crs$testset[,c(crs$input)], type='class')"
' Extract the relevant variables from the dataset.
R.EvaluateNoReturn "sdata <- subset(crs$testset[,], select=c('record', 'id'))"
' Output the combined data.
R.EvaluateNoReturn "write.csv(cbind(sdata, crs$pr), file='"&CurrentPath&"/results/ExportFile_score_idents.csv', row.names=FALSE)"
' Create plot file for the Decision Tree.
R.EvaluateNoReturn "setwd('"&CurrentPath&"/New Plots')"
R.EvaluateNoReturn "png('R_Score_Plot_1_"&Runtime&".png')"
R.EvaluateNoReturn "plot(crs$rpart)"
R.EvaluateNoReturn "text(crs$rpart, use.n=TRUE)"
R.EvaluateNoReturn "title(main='Decision Tree', sub=format(Sys.time(), '%a %b %d %X %Y'), col.main='blue', col.sub='black', line='2', font.main=4, font.sub=3)"
R.EvaluateNoReturn "dev.off()"
'''''''''''''''''''''''''''''''''''''''''''''''''''''''''''''''''''''''''''''''''''''''''''''''''''''''''''''''''''''''''''''''''''''''''''''''''''''''
' Create Bar plot
'''''''''''''''''''''''''''''''''''''''''''''''''''''''''''''''''''''''''''''''''''''''''''''''''''''''''''''''''''''''''''''''''''''''''''''''''''''''
' The 'gplots' package provides the 'barplot2' function.
R.EvaluateNoReturn "require(gplots, quietly=TRUE)"
R.EvaluateNoReturn "set.seed(crv$seed)"
' Load the data.
R.EvaluateNoReturn "crs$dataset <- read.csv('"&CurrentPath&"/data/readmission.csv', na.strings=c('.', 'NA', '', '?'), strip.white=TRUE, encoding='UTF-8')"
' Generate the summary data for plotting.
R.EvaluateNoReturn "ds <- rbind(summary(na.omit(crs$dataset[crs$sample,]$sex)), summary(na.omit(crs$dataset[crs$sample,][crs$dataset[crs$sample,]$death=='0',]$sex)), summary(na.omit(crs$dataset[crs$sample,][crs$dataset[crs$sample,]$death=='1',]$sex)))"
' Sort the entries.
R.EvaluateNoReturn "ord <- order(ds[1,], decreasing=TRUE)"
R.EvaluateNoReturn "setwd('"&CurrentPath&"/New Plots')"
R.EvaluateNoReturn "png('R_Score_Plot_4_"&Runtime&".png')"
' Plot the data.
R.EvaluateNoReturn "bp <- barplot2(ds[,ord], beside=TRUE, ylab='Frequency', xlab='Sex', ylim=c(0, 455), col=rainbow_hcl(3))"
'Add the actual frequencies.
R.EvaluateNoReturn "text(bp, ds[,ord]+15, ds[,ord])"
'Add a legend to the plot.
R.EvaluateNoReturn "legend('topright', bty='n', c('All','0','1'), fill=rainbow_hcl(3))"
'Add a title to the plot.
R.EvaluateNoReturn "title(main='Distribution of sex (sample)by death', sub=paste(format(Sys.time(), '%a %b %d %X %Y')), col.main='blue', col.sub='black', line='2', font.main=4, font.sub=3)"
R.EvaluateNoReturn "dev.off()"
'''''''''''''''''''''''''''''''''''''''''''''''''''''''''''''''''''''''''''''''''''''''''''''''''''''''''''''''''''''''''''''''''''''''''''''''''''''
'''''''''''''''''''''''''''''''''''''''''''''''''''''''''''''''''''''''''''''''''''''''''''''''''''''''''''''''''''''''''''''''''''''''''''''''''''''
' Close R connection
R.close
Set v = ActiveDocument.GetVariable("vRuntime")
v.SetContent Runtime(), True
' Load the scores into the QlikView application
ActiveDocument.DoReload 2, false,false 'Fail on error, Partial Reload
WriteLog("Retrieved Scores from R at "&Runtime&".")
End Sub
'''''''''''''''''''''''''''''''''''''''''''''''''''''''''''''''''''''''''''''''''''''''''''''''''''''''''''''''''''''''''''''
'''''''''''''''''''''''''''''''''''''''''''''''''''''''''''''''''''''''''''''''''''''''''''''''''''''''''''''''''''''''''''''
'''''''''''''''''''''''''''''''''''''''''''''''''''''''''''''''''''''''''''''''''''''''''''''''''''''''''''''''''''''''''''''
Function CurrentPath()
Set v = ActiveDocument.GetVariable("vAppPath")
CurrentPath = Replace(v.GetContent.String,"\","/")
End Function
'''''''''''''''''''''''''''''''''''''''''''''''''''''''''''''''''''''''''''''''''''''''''''''''''''''''''''''''''''''''''''''
Function Runtime()
dtmThisDay = Right(Cstr(Day(Date) + 100),2)
dtmThisMonth = Right(Cstr(Month(Date) + 100),2)
dtmThisYear = Year(Date)
dtmThisHour = Right(Cstr(Hour(Time) + 100),2)
dtmThisMinute = Right(Cstr(Minute(Time) + 100),2)
dtmThisSecond = Right(Cstr(Second(Time) + 100),2)
Runtime = dtmThisYear & dtmThisMonth & dtmThisDay & dtmThisHour & dtmThisMinute & dtmThisSecond
End Function
'''''''''''''''''''''''''''''''''''''''''''''''''''''''''''''''''''''''''''''''''''''''''''''''''''''''''''''''''''''''''''''
Function openOutputFile(filename)
'Create and open an output file
Const ForWriting = 2
Set objFSO = CreateObject("Scripting.FileSystemObject")
Set openOutputFile = objFSO.OpenTextFile(filename, ForWriting, True)
End Function
'''''''''''''''''''''''''''''''''''''''''''''''''''''''''''''''''''''''''''''''''''''''''''''''''''''''''''''''''''''''''''''
Function WriteLog(message)
set logFile = openOutputFile(LOGFILE_NAME)
logFile.WriteLine(message)
logFile.Close
End Function
'''''''''''''''''''''''''''''''''''''''''''''''''''''''''''''''''''''''''''''''''''''''''''''''''''''''''''''''''''''''''''''
Here I want to select some id's from the list box and trying to reflect the values as a tree model and as a bar plot on two different text object. The .png files are generating but the value is not reflecting there. I'm giving the Text objects code:
1. Here I'm showing the tree model
=vAppPath&'\New Plots\R_Score_Plot_1_'&$(vRuntime)&'.png'
2. Here I'm showing the Bar plot
=vAppPath&'\New Plots\R_Score_Plot_4_'&$(vRuntime)&'.png'
Thats all. Any suggestion will be helpful.
- Mark as New
- Bookmark
- Subscribe
- Mute
- Subscribe to RSS Feed
- Permalink
- Report Inappropriate Content
Hola Elif Tutuk: Estoy haciendo predicciones con R pero necesito poder visualizar la información en QlikView, estoy usando el conector statcon Dcom, pero no sé qué configuar en la macro, mis resultados están efectuados en R sólo falta mostrarlo en QlikView.
Quedo atenta a tus comentarios, gracias
- Mark as New
- Bookmark
- Subscribe
- Mute
- Subscribe to RSS Feed
- Permalink
- Report Inappropriate Content
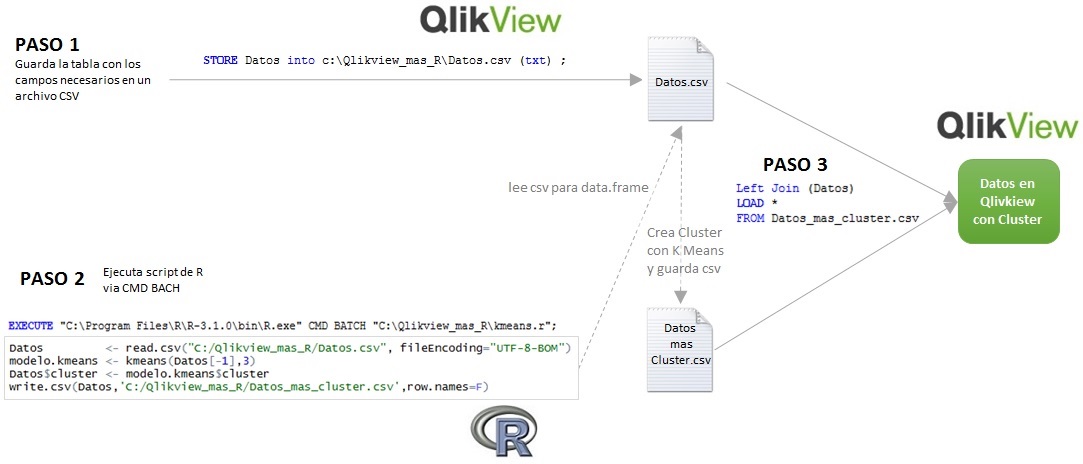
this is another technique without macro (en español):
http://qlikviewapuntes.blogspot.com/2015/03/qlikview-r-para-kmeans.HTML
- « Previous Replies
- Next Replies »