Unlock a world of possibilities! Login now and discover the exclusive benefits awaiting you.
- Qlik Community
- :
- All Forums
- :
- QlikView Integrations
- :
- Re: SVG maps extension issues
- Subscribe to RSS Feed
- Mark Topic as New
- Mark Topic as Read
- Float this Topic for Current User
- Bookmark
- Subscribe
- Mute
- Printer Friendly Page
- Mark as New
- Bookmark
- Subscribe
- Mute
- Subscribe to RSS Feed
- Permalink
- Report Inappropriate Content
SVG maps extension issues
I started experimenting with the SVG-maps about a year ago. At that time it work perfectly fine on my own installation of qlikview. I think it was 11.2 SR 3 or 4. The client for whom I was asked to do this had an earlier Service release and it didn't work. The upgrade wasn't priority until recently so I just picked up on this again. Today both myself and the client run 11.2 SR5 and all of a sudden the extension does not function properly for either of us.
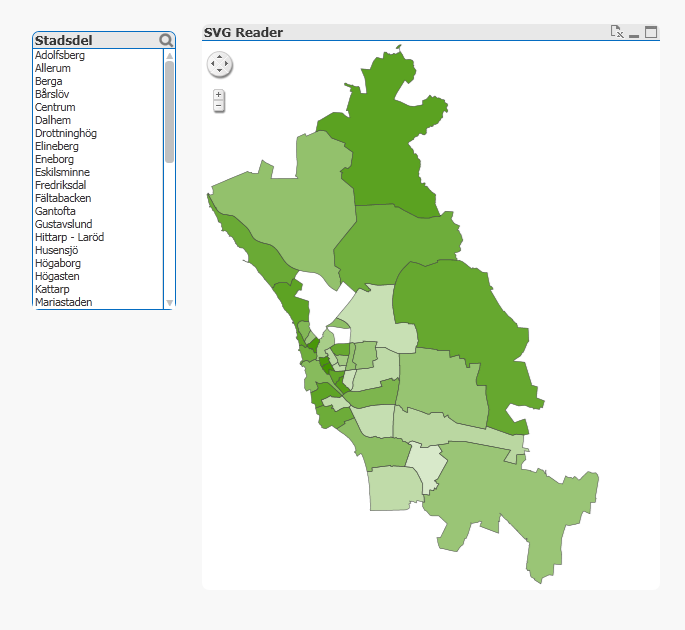
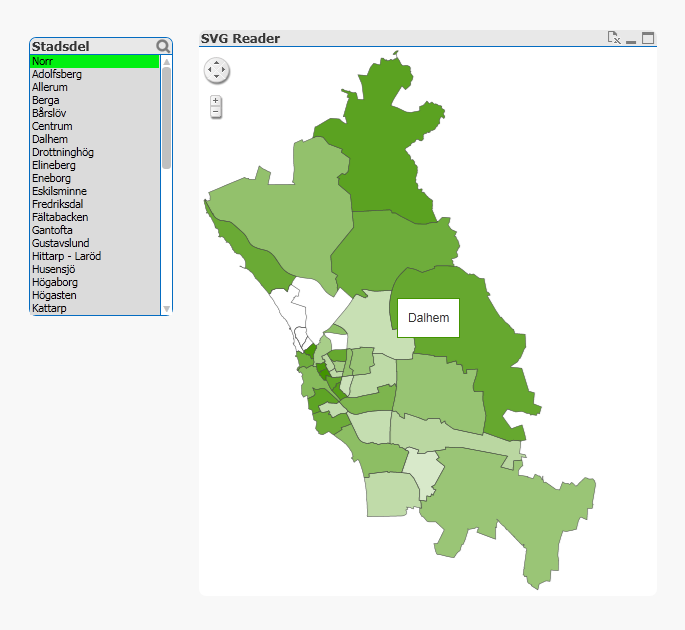
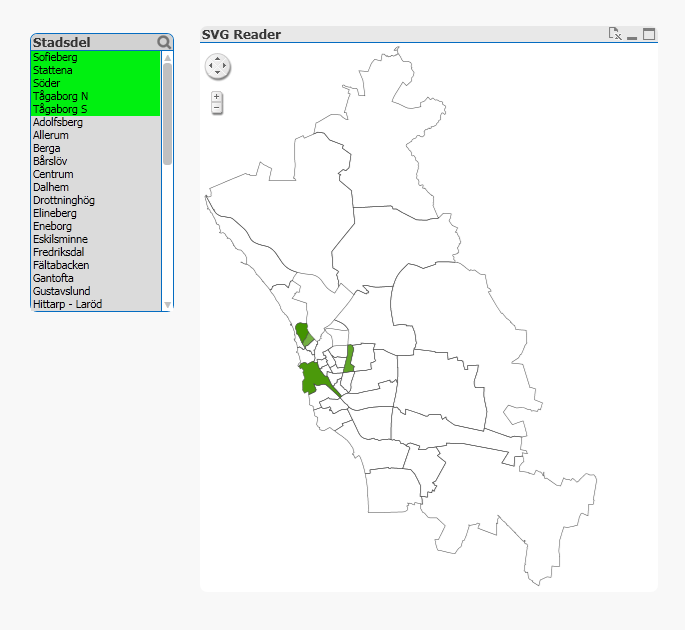
The map has been exported from some architect-program that I'm not familiar with from the City's Urban Planning Office. Last year I had to open it in Inkscape and save it for it to work. Today two of the city districts are white from the start with no tool-tip possible on these two areas. If I make a selection more areas just become white? There are a few selections that functions as expected but the majority does not. Why is this? is there anyone here who can make this work for me or has a clue on what the problem might be?
I'm using the latest version of SVG-maps taken from GIT-hub.
Attached is all related files
Thank you for taking your time.
Two city areas are white...

A selection makes more areas white...

Some fields work though.

- « Previous Replies
-
- 1
- 2
- Next Replies »
Accepted Solutions
- Mark as New
- Bookmark
- Subscribe
- Mute
- Subscribe to RSS Feed
- Permalink
- Report Inappropriate Content
Hello Linus,
I found a fix for your specific problem with SVGMaps. By adding line 580 to the script.js file of the extension. I hardcoded the color to be white but that can be easily changed if needed.

Best
Johan
- Mark as New
- Bookmark
- Subscribe
- Mute
- Subscribe to RSS Feed
- Permalink
- Report Inappropriate Content
Linus,
I had to abandon the SVG Map idea because I would get random errors, issues like yours, and it was slow/clunky compared to other mapping extensions out there. I highly suggest you take a look at QuickMaps v11 ( https://github.com/brianwmunz/QuickMap-QV11)
1. For single points, your second dimension should just be lat/long ex. 39.67006 -104836792
2. For whole states/counties/zipcodes you have to draw a polygon using the latitude and longitude and the lines must connect for the polygon to be able to shade.
I got my lat/long from google fusion tables and downloaded the sheet as an excel file and parsed out the lat/long to do this.
You can also pass a tile server link (OpenStreetMaps) in for different mapping features like typography etc.

So overall it was a lot more flexible, stable, and quicker than SVG Maps. I know this doesn't directly answer your question but there are suitable alternatives out there if you can't get the SVG Map to work.
- Mark as New
- Bookmark
- Subscribe
- Mute
- Subscribe to RSS Feed
- Permalink
- Report Inappropriate Content
Thanks for your comments Alex,
I would gladly abandon the SVG maps extension but the problem is that what I have is an SVG file and there does not seem to be an easy way to convert SVG to KML. A quick google gives lots of hits on converting KML to SVG but not the other way around?
- Mark as New
- Bookmark
- Subscribe
- Mute
- Subscribe to RSS Feed
- Permalink
- Report Inappropriate Content
Actually I might have solved the problem. By deleting all other maps and only keeping the one I want to use. In the Definitions-, Properties and DynProperties files it seems to be working. I still haven't tested it on the server though. I think all maps are loaded into the memory which is a little to much to handle for QV.
- Mark as New
- Bookmark
- Subscribe
- Mute
- Subscribe to RSS Feed
- Permalink
- Report Inappropriate Content
From my quick research there's no way to convert SVG because the "d" path does not correspond to a Lat/Long it's a just a move to/line to etc. (SVG Path). So if I were to have an SVG file I couldn't parse out the "d" and use those integers as coordinates.
If that doesn't fix it, let me know the area (I think it's Sweden?) and granularity (Just the Cities?) and I'll see if I can put something together with OpenStreetMaps.
- Mark as New
- Bookmark
- Subscribe
- Mute
- Subscribe to RSS Feed
- Permalink
- Report Inappropriate Content
Hello Linus,
I found a fix for your specific problem with SVGMaps. By adding line 580 to the script.js file of the extension. I hardcoded the color to be white but that can be easily changed if needed.

Best
Johan
- Mark as New
- Bookmark
- Subscribe
- Mute
- Subscribe to RSS Feed
- Permalink
- Report Inappropriate Content
I'm sorry, I totally missed your reply. We have it working now with the SVG maps plugin but in response to your question the city is helsingborg in sweden.
Is it possible to add a polygon layer to open street maps?
Anyway thanks for your reply
- Mark as New
- Bookmark
- Subscribe
- Mute
- Subscribe to RSS Feed
- Permalink
- Report Inappropriate Content
Linus,
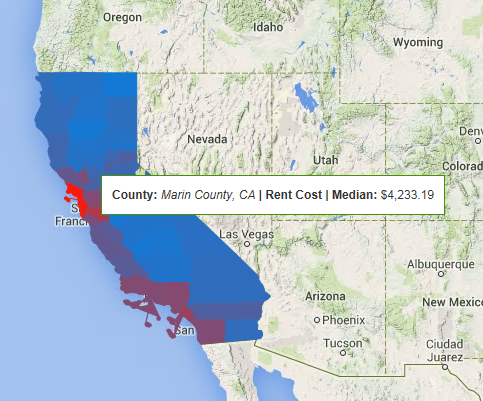
Yea the picture I posted above of California are polygons of each county layered on OSM.
In order to fill in the polygons with a color, you have to draw a complete circle (not a literal circle, but connect the latitudes/longitudes) which is the most difficult part. If you don't connect the lat/long you'll just have line which will not fill in with color.
Once you draw the polygons, OSM is much more flexible in that I can pass in different tile servers and look at things like topography, hike & bike trails, satellite, and roads. I can also zoom in and out (which I think you can do with SVG maps anyway) but it's much more powerful to zoom in and out when you're on the satellite tile server (for example) and see people's houses.
- Mark as New
- Bookmark
- Subscribe
- Mute
- Subscribe to RSS Feed
- Permalink
- Report Inappropriate Content
Hi everyone,
I've posted an updated version of this extension on Qlik Branch.
http://branch.qlik.com/projects/showthread.php?136-SVG-Map-Extension
Hopefully this one fixes the issues everyone was having. It also adds some new functionality, such as the ability to blend two colors on an SVG map.
Please let me know, thanks!
- Mark as New
- Bookmark
- Subscribe
- Mute
- Subscribe to RSS Feed
- Permalink
- Report Inappropriate Content
Hi Brian,
I'm using the different maps from the SVG Maps extension and want to place them on top of one another so that the world map appears when nothing is selected and whenever a country is selected, the relevant map appears. I have done this using the conditional show options in the web view and it works however I cant see the layer option in the web view to make the country maps at the top as they appear but behind the world map. I tried going into the sheet properties in the normal view and changing the layer for the object from there but that just makes the map to go blank. Is there any other solution for this?
Many Thanks,
Mohammad.
- « Previous Replies
-
- 1
- 2
- Next Replies »