Unlock a world of possibilities! Login now and discover the exclusive benefits awaiting you.
- Qlik Community
- :
- All Forums
- :
- QlikView App Dev
- :
- Re: Calculating a percentage
- Subscribe to RSS Feed
- Mark Topic as New
- Mark Topic as Read
- Float this Topic for Current User
- Bookmark
- Subscribe
- Mute
- Printer Friendly Page
- Mark as New
- Bookmark
- Subscribe
- Mute
- Subscribe to RSS Feed
- Permalink
- Report Inappropriate Content
Calculating a percentage
Hi,
I’m attempting to display the percentage of processing time for various jobs. I initially created a straight table chart with the following:
Dimensions:
Effective Date
Job Group
Expression
Sum([Duration In Minutes])
Relative is checked.
I have about 25 job groups. The problem is that when I select a few job groups instead of displaying all job groups my expression displays numbers that increase so that the total is 100%. That’s not accurate.
What I need is for the correct percentages to be displayed whether displaying all the job groups or only looking at a few.
Any help would be greatly appreciated.
- Mark as New
- Bookmark
- Subscribe
- Mute
- Subscribe to RSS Feed
- Permalink
- Report Inappropriate Content
Using "Relative" will always lead to the total of 100%, so in won't be useful in your case.
Instead, calculate the % manually, using keyword ALL - it means ignoring chart dimensions and user selections:
Sum([Duration In Minutes])/Sum( ALL [Duration In Minutes])
If you need a more granular definition of what selections to respect and what selections to ignore, then you'll need to replace ALL with a corresponding Set Analysis condition.
best,
Oleg Troyansky
- Mark as New
- Bookmark
- Subscribe
- Mute
- Subscribe to RSS Feed
- Permalink
- Report Inappropriate Content
Hi,
Thanks for your response. I tried this which got me what I need.
sum([Duration In Minutes])/Sum( TOTAL [Duration In Minutes])
- Mark as New
- Bookmark
- Subscribe
- Mute
- Subscribe to RSS Feed
- Permalink
- Report Inappropriate Content
Actually, what I ended up doing that got me what I really needed was modified the load script to include:
EffectiveDateDurationAgg:
LOAD "Effective Date",
sum("Duration In Minutes") as [Daily Total Duration]Resident MetricHist
Group By "Effective Date";
Then I modified my expression to
=sum([Duration In Minutes])/sum([Daily Total Duration])
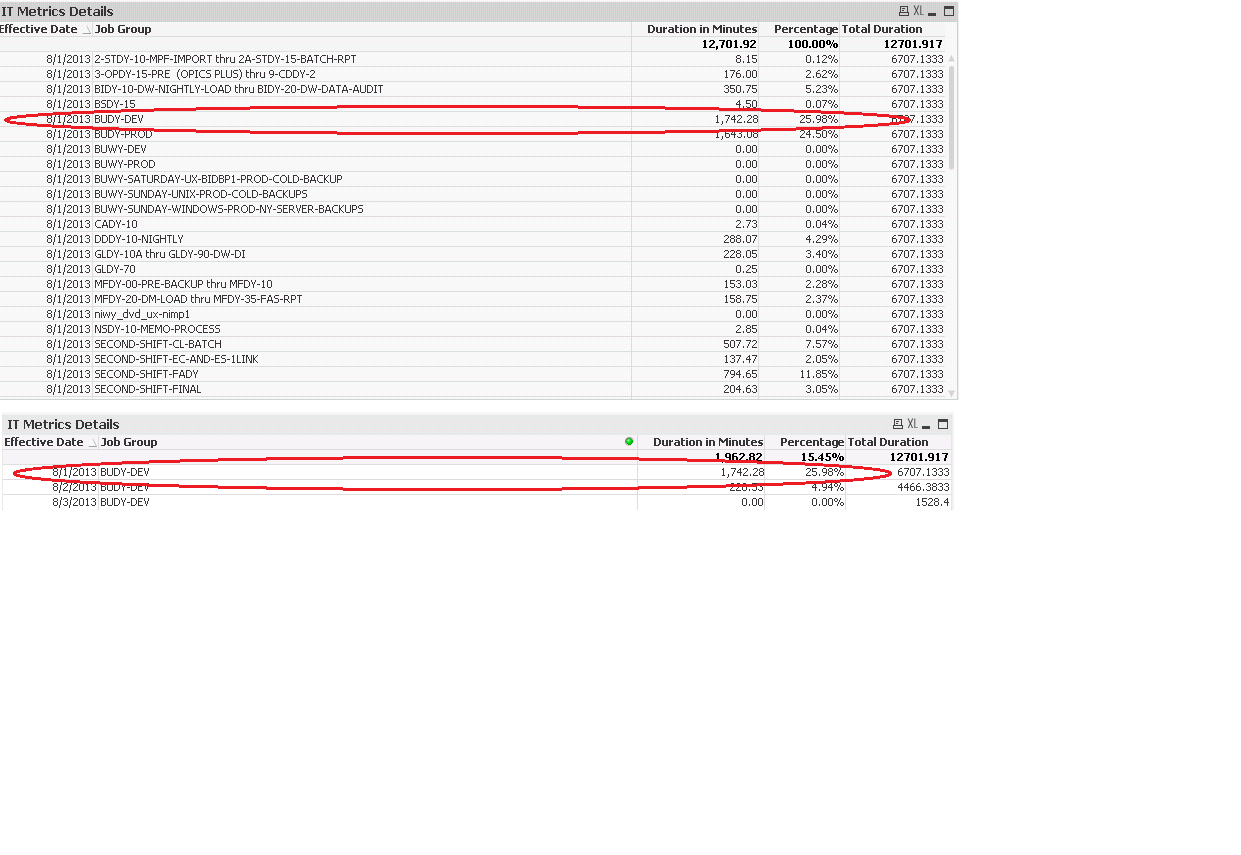
Now when I select a job, the percentage remains unchanged. If I selected a job before it would change from the actual percentage to 100%.
- Mark as New
- Bookmark
- Subscribe
- Mute
- Subscribe to RSS Feed
- Permalink
- Report Inappropriate Content
Attached is an example of the results.
- Mark as New
- Bookmark
- Subscribe
- Mute
- Subscribe to RSS Feed
- Permalink
- Report Inappropriate Content
Hi,
You created th total in script so it always be static.
For dynamic based on selction you should use
=sum([Duration In Minutes])/sum(Total <[Effective Date]> [Duration In Minutes])