Unlock a world of possibilities! Login now and discover the exclusive benefits awaiting you.
- Qlik Community
- :
- All Forums
- :
- QlikView App Dev
- :
- Re: Count customers that generate 80%
- Subscribe to RSS Feed
- Mark Topic as New
- Mark Topic as Read
- Float this Topic for Current User
- Bookmark
- Subscribe
- Mute
- Printer Friendly Page
- Mark as New
- Bookmark
- Subscribe
- Mute
- Subscribe to RSS Feed
- Permalink
- Report Inappropriate Content
Count customers that generate 80%
Hi ,
In this thread http://community.qlik.com/message/160141#160141 i came accross a demo that show you how to get the TOP N% depending on the sliding bar that you set. This works great in my model to show how many customers generate 80% of the business - i count the customers as in demo.
Now i have a request to add another dimension Territory in so that the user can see per Territory how many customers generate 80% of business. This mean i must show all territories, and in each territory the customers in that territory makes up 100 % but it must show me also the 80% . I need to count these that makes up 80% of business
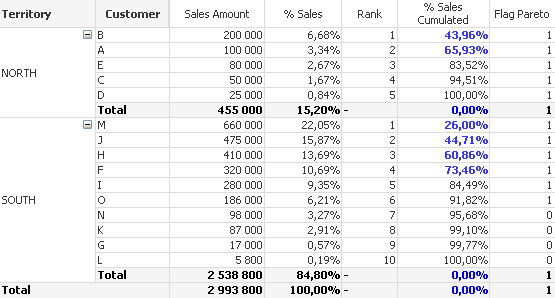
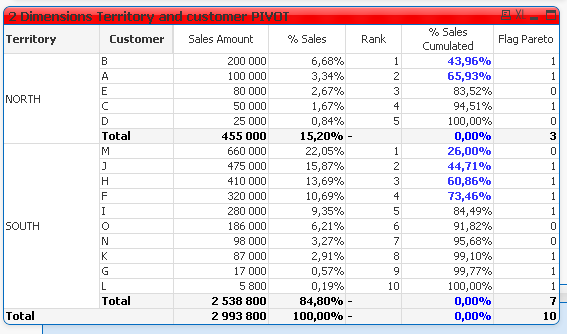
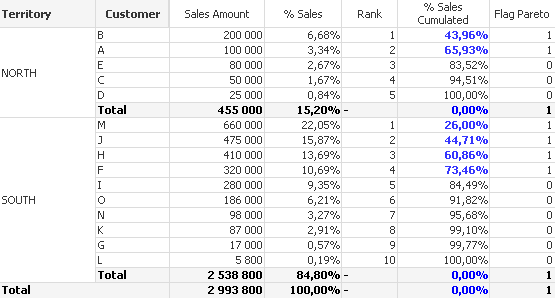
In a pivot i would work great if i can group it by territory. In the example i have a table (blue) and n pivot(red). In the table the split dont occur between territories to indicate which customers makes up 80% per territory. The pivot would work brilliant if i can get it rolled up to show 100% for each territory and when you expand it, it shows you the customer percentage split that makes up for instance 80% and down to 100% per territory. The whole exercise is to count the customers per territory that makes up 80% of business but also show you the rest of customers.
If this is not possible in a pivot is there a way to do it in a table ?
Help would really be appreciated, i am stuck with this now for a while.
Regards
Louw
- Mark as New
- Bookmark
- Subscribe
- Mute
- Subscribe to RSS Feed
- Permalink
- Report Inappropriate Content
Hi Louwrie,
Try with <SubTotal >. Is very useful with Pivot Tables.
Example:
In the expression ""% Sales Cumulated"
If(
RowNo() = 1,
Sum([Sales Amount]),
RangeSum(Above(Sum([Sales Amount]), 0, RowNo()))
)
/
Sum(TOTAL <Territory> [Sales Amount])
- Mark as New
- Bookmark
- Subscribe
- Mute
- Subscribe to RSS Feed
- Permalink
- Report Inappropriate Content
Hi Manuel,
Thank you for your reply, i did use you <Territory> and this work great in the pivot. But i still need to count the customers in this territory that fall in the bracket of 80% for instance. I wrote the expression with aggr and this sum the total correct but flag pareto field is not flagging the correct customers so the sum is calculating the wrong customers. Only customers that falls into the bracket of 80% must be flagged with a 1.
sum ( aggr ( If ( Rangesum ( Above ( sum ( [Sales Amount] ) ,0 , Rowno() )) / sum ( Total <Territory> [Sales Amount] ) <= v_Pareto_Persentage , 1 , 0) , Territory , Customer ))
Would appreciate help.
Regards
Louw
- Mark as New
- Bookmark
- Subscribe
- Mute
- Subscribe to RSS Feed
- Permalink
- Report Inappropriate Content
Hi,
Does anyone have advise here i have tried several variations of AGGR but with no success. The total per territory of the column flag pareto is now correct but my if statement flag the wrong customers now. It must just flag the customers that falls in the 80% bracket.
thank you
Louw
- Mark as New
- Bookmark
- Subscribe
- Mute
- Subscribe to RSS Feed
- Permalink
- Report Inappropriate Content
Hi,
If you are using the version 11 and the chart type is Straight table, then you can try this by using Dimension limit option of the chart.
Here you can set the limit option as you want.
Hope this will help.
Regards,
Kaushik Solanki
- Mark as New
- Bookmark
- Subscribe
- Mute
- Subscribe to RSS Feed
- Permalink
- Report Inappropriate Content
Hi Kaushik,
Unfortunattely i use version 10 and i still would like to show all customers that fall outside the 80% bracket as well but they must be flagged with a '0'.
This is so urgent for me now, any other idea to solve this flagging issue ?
Regards
Louw
- Mark as New
- Bookmark
- Subscribe
- Mute
- Subscribe to RSS Feed
- Permalink
- Report Inappropriate Content
Hello Louwrie,
No I had understood what the Flag.
Try with:
If( RangeSum(Above(Sum([Sales Amount]), 0, RowNo())) / Sum(TOTAL <Territory> [Sales Amount]) <= v_Pareto_Percentage,
1,
0
)
But I recommend you use:
If([% Sales Cumulated] <= v_Pareto_Percentage,1,0)
The Aggr is useful in to calculated dimension, but this field is not an dimension, is an expression field.
I hope, it is that you need.
- Mark as New
- Bookmark
- Subscribe
- Mute
- Subscribe to RSS Feed
- Permalink
- Report Inappropriate Content
Hi Manuel,
I have tried your suggestion of if ([% Sales Cumulated] <= v_Pareto_Percentage, 1, 0) but i am still looking for the correct total of Flag Perto for the territory in the pivot.
In the screenshot you posted the total of field Flag Pareto in territory north must be 2 and the south must be 4. That is why i was trying to use the Aggr
Thank you for your help
Regards
Louwrie