Unlock a world of possibilities! Login now and discover the exclusive benefits awaiting you.
- Qlik Community
- :
- All Forums
- :
- QlikView App Dev
- :
- Suggestions required on how best can we show phase...
- Subscribe to RSS Feed
- Mark Topic as New
- Mark Topic as Read
- Float this Topic for Current User
- Bookmark
- Subscribe
- Mute
- Printer Friendly Page
- Mark as New
- Bookmark
- Subscribe
- Mute
- Subscribe to RSS Feed
- Permalink
- Report Inappropriate Content
Suggestions required on how best can we show phases of a project in QlikView
Hello Everyone,
Need your suggestions on how best I can display the following requirement in QlikView.
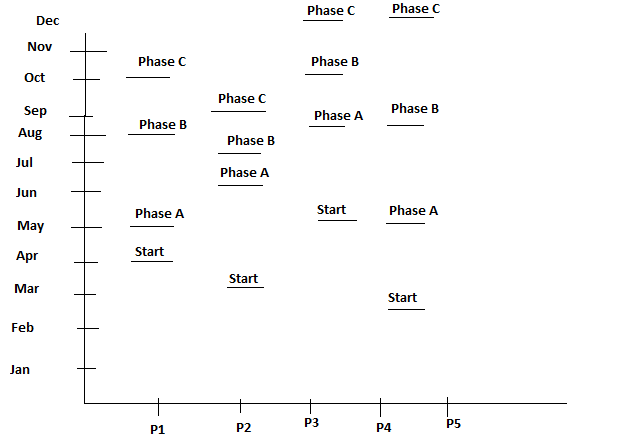
One particular project goes through three phases. And these phases have months as their values, which depict months in which a particular project undergoes that particular phase as shown in the below table. I would like to show something like, when does a particular project start (i.e., the "month" when it starts) followed by the "month" it enters Phase A, then "month" when it enters Phase B, then Phase C. How best can I display this in QlikView (I don't want to display this info in a straight table). Any chart that can visually give such an info when viewed? Is it possible to display something like shown in the attached picture? (though I doubt this is possible!)
| Projects | Start Date | Phase A | Phase B | Phase C |
|---|---|---|---|---|
| P1 | 04/2017 | 05/2017 | 08/2017 | 10/2017 |
| P2 | 03/2017 | 06/2017 | 07/2017 | 09/2017 |
| P3 | 05/2017 | 08/2017 | 10/2017 | 12/2017 |
| P4 | 02/2017 | 05/2017 | 08/2017 | 12/2017 |
Any help on this?
Thank you.
Accepted Solutions
- Mark as New
- Bookmark
- Subscribe
- Mute
- Subscribe to RSS Feed
- Permalink
- Report Inappropriate Content
Maybe something like this is helpful to get ideas:
Files for creation of a Gantt chart
How to create a Gantt chart using a Pivot table
- Marcus
- Mark as New
- Bookmark
- Subscribe
- Mute
- Subscribe to RSS Feed
- Permalink
- Report Inappropriate Content
Maybe something like this is helpful to get ideas:
Files for creation of a Gantt chart
How to create a Gantt chart using a Pivot table
- Marcus
- Mark as New
- Bookmark
- Subscribe
- Mute
- Subscribe to RSS Feed
- Permalink
- Report Inappropriate Content
Hi Marcus,
That was helpful. Thank you