Unlock a world of possibilities! Login now and discover the exclusive benefits awaiting you.
- Qlik Community
- :
- All Forums
- :
- QlikView App Dev
- :
- Averaging data between two time periods for multip...
- Subscribe to RSS Feed
- Mark Topic as New
- Mark Topic as Read
- Float this Topic for Current User
- Bookmark
- Subscribe
- Mute
- Printer Friendly Page
- Mark as New
- Bookmark
- Subscribe
- Mute
- Subscribe to RSS Feed
- Permalink
- Report Inappropriate Content
Averaging data between two time periods for multiple dates
Hi All,
I got stuck under a peculiar situation when I am trying create a dashboard. I have the following data sample with me (also attached in the excel file with c. 200K rows data). Now, the "ROLLING SYSTEM" data is the primary key here and the "Time" field is derived from 'ROLLING SYSTEM' field. One catch here is that time is not consistent with 5 minutes interval (although it is there for most of the times, but I can't make any exceptions as every day new data will be appended).
| ROLLING SYSTEM | Time | DEMAND |
| 20150715000000 | 00:00:00 | 24549 |
| 20150715000500 | 00:05:00 | 24570 |
| 20150715002000 | 00:20:00 | 24078 |
| 20150715002500 | 00:25:00 | 23968 |
| 20150715003000 | 00:30:00 | 23924 |
| 20150715003500 | 00:35:00 | 23985 |
| 20150715004500 | 00:45:00 | 23958 |
| 20150715005000 | 00:50:00 | 23830 |
| 20150715005500 | 00:55:00 | 23468 |
| 20150715010000 | 01:00:00 | 23356 |
| 20150715012000 | 01:20:00 | 23134 |
| 20150715012500 | 01:25:00 | 23025 |
| 20150715013000 | 01:30:00 | 22912 |
| 20150715013500 | 01:35:00 | 22900 |
| 20150715014000 | 01:40:00 | 22829 |
| 20150715014500 | 01:45:00 | 22820 |
| 20150715015000 | 01:50:00 | 22801 |
| 20150715015500 | 01:55:00 | 22709 |
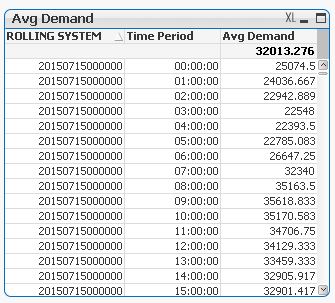
What I would like to have in the output is average demand for every hourly period against the ending hour time period.
i.e. against 01:00:00 the average demand should be average of 'Demand' field data for time period >= 00:00:00 and <01:00:00;
against 02:00:00 the average demand should be average of 'Demand' field data for time period >= 01:00:00 and <02:00:00; and so on. Something like this:
| Time Period | Average Demand |
| 01:00:00 | 24036.6667 |
| 02:00:00 | 22942.8889 |
| 03:00:00 | 22548.0000 |
| 04:00:00 | 22393.5000 |
It would be great if anyone can help me out with this. thanks a ton in advance. best regards, Anand
- Mark as New
- Bookmark
- Subscribe
- Mute
- Subscribe to RSS Feed
- Permalink
- Report Inappropriate Content
Hi,
Try the attached
- Mark as New
- Bookmark
- Subscribe
- Mute
- Subscribe to RSS Feed
- Permalink
- Report Inappropriate Content
Hi Anand
You could try using the hour() function. hour ‒ QlikView
Either you create a calculated dimension in the object or a new field in your dimensiontabel, and add 1 to the hour value so 00:05:00 and 00:55:00 becomes "1" etc.
An alternative solution and if you want a better label, you could try to round your timestamp by the following solution based on hour and string manipulation using:
Time:
LOAD * INLINE [
Time
00:05:00
00:55:00
01:05:00
];
TimeRound:
Load *,
time(hour([Time]) +1 & ':00:' & '00') as RoundTime
Resident Time;
Else look into the following thread for other ways to round a timestamp to whole hours.
- Mark as New
- Bookmark
- Subscribe
- Mute
- Subscribe to RSS Feed
- Permalink
- Report Inappropriate Content
Many thanks Varun for your reply. I guess I missed one point here. The average demand needs to be calculated for every hour for each time period for all the dates given (dated are given in the first column of attached excel 'ROLLING SYSTEM' field, where the first eight characters gives us date in 'YYYYMMDD' format. The output should be something like:
| ROLLING SYSTEM | Time Period | Average Demand |
| 20150715000000 | 1:00:00 | 24036.6667 |
| 20150715000000 | 2:00:00 | 22942.8889 |
| 20150715000000 | 3:00:00 | 22548 |
| 20150715000000 | 4:00:00 | 22393.5 |
| 20150716000000 | 1:00:00 | 25554.2 |
| 20150716000000 | 2:00:00 | 25457.1 |
Many thanks in advance for your help here. Best regards, Anand
- Mark as New
- Bookmark
- Subscribe
- Mute
- Subscribe to RSS Feed
- Permalink
- Report Inappropriate Content
Hi Anand,
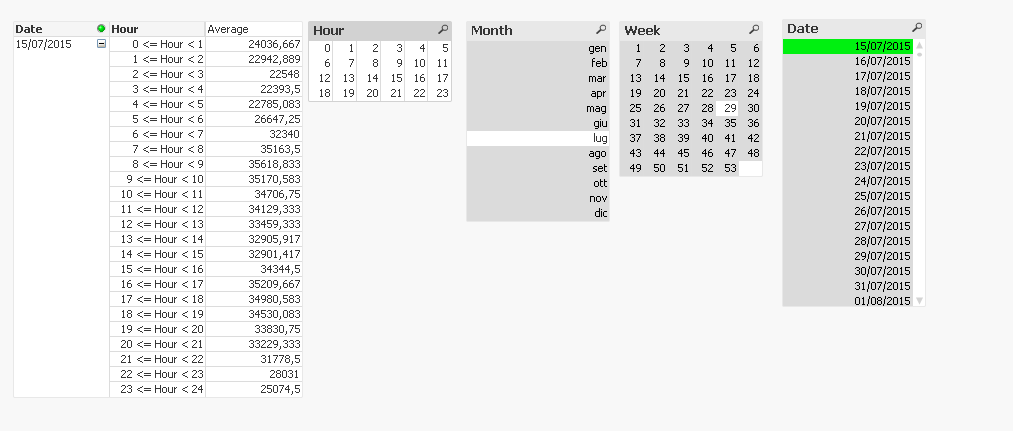
Please find the attached updated qvw
- Mark as New
- Bookmark
- Subscribe
- Mute
- Subscribe to RSS Feed
- Permalink
- Report Inappropriate Content
Hi Anand,
see Attachment.
Regards,
Antonio.
- Mark as New
- Bookmark
- Subscribe
- Mute
- Subscribe to RSS Feed
- Permalink
- Report Inappropriate Content
may be this
Data:
LOAD [ROLLING SYSTEM],
date(date#(left([ROLLING SYSTEM],8),'YYYYMMDD'),'YYYYMMDD') as Date,
time#(Time,'hh:mm:ss') as Time,
DEMAND
FROM
[Final Demand Data.xlsx]
(ooxml, embedded labels, table is Sheet1);
New:
NoConcatenate
LOAD Time,
Date&'000000' as [ROLLING SYSTEM],
Time(Time + maketime(1,0,0),'hh')&':00:00' as [Time Period],
DEMAND
Resident Data;
DROP Table Data;