Unlock a world of possibilities! Login now and discover the exclusive benefits awaiting you.

- Qlik Community
- :
- All Forums
- :
- QlikView
- :
- Re: Bar Chart Trendline
- Subscribe to RSS Feed
- Mark Topic as New
- Mark Topic as Read
- Float this Topic for Current User
- Bookmark
- Subscribe
- Mute
- Printer Friendly Page

- Mark as New
- Bookmark
- Subscribe
- Mute
- Subscribe to RSS Feed
- Permalink
- Report Inappropriate Content
Bar Chart Trendline
Just wondering if anyone can help me I am looking to create a bar chart showing month on month a trendline showing a percentage increase or decrease from month to month for each year.
It's the figure Income/Accounts from the Excel attachment that I am trying to get the trendline on if anyone can advise me.
- Tags:
- new_to_qlikview
Accepted Solutions

 awhitfield
- Mark as New
- Bookmark
- Subscribe
- Mute
- Subscribe to RSS Feed
- Permalink
- Report Inappropriate Content
No problem line expression has Value on data point too:
Missed that bit!
Andy

 qlikmsg4u
- Mark as New
- Bookmark
- Subscribe
- Mute
- Subscribe to RSS Feed
- Permalink
- Report Inappropriate Content
Hi Sue,
This is what your are looking for?
!
- Mark as New
- Bookmark
- Subscribe
- Mute
- Subscribe to RSS Feed
- Permalink
- Report Inappropriate Content
Hi thanks for the reply,
Unfortunately I am only using the personal edition is their anyway you could put it in here what you done if you could.
Thanks again for your reply.
awhitfield
- Mark as New
- Bookmark
- Subscribe
- Mute
- Subscribe to RSS Feed
- Permalink
- Report Inappropriate Content
Hi Sue,
this is the chart;
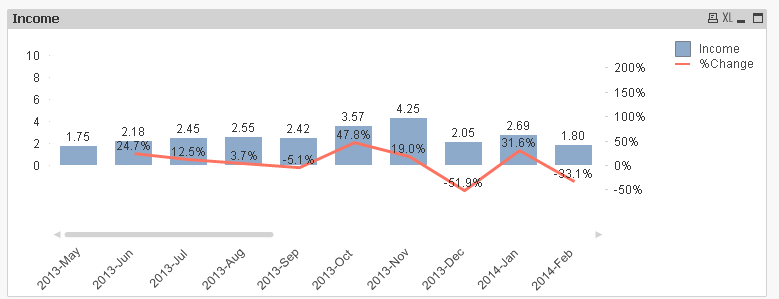
Chart = Combo
Dimension = YearMonth
Bar Expression = Sum([Income/Accounts]) , with values on Data Points
Line Expression = sum([Income/Accounts]) / Above(sum([Income/Accounts])) -1
HTH - Andy
- Mark as New
- Bookmark
- Subscribe
- Mute
- Subscribe to RSS Feed
- Permalink
- Report Inappropriate Content
Hi Andrew,
I have the chart with the values on top but my line is not giving me the percentage difference it is probably something I am forgetting to do.
awhitfield
- Mark as New
- Bookmark
- Subscribe
- Mute
- Subscribe to RSS Feed
- Permalink
- Report Inappropriate Content
No problem line expression has Value on data point too:
Missed that bit!
Andy