Unlock a world of possibilities! Login now and discover the exclusive benefits awaiting you.

- Qlik Community
- :
- All Forums
- :
- QlikView
- :
- Re: Bar Chart with variable bar
- Subscribe to RSS Feed
- Mark Topic as New
- Mark Topic as Read
- Float this Topic for Current User
- Bookmark
- Subscribe
- Mute
- Printer Friendly Page

- Mark as New
- Bookmark
- Subscribe
- Mute
- Subscribe to RSS Feed
- Permalink
- Report Inappropriate Content
Bar Chart with variable bar
Hi everyboy,
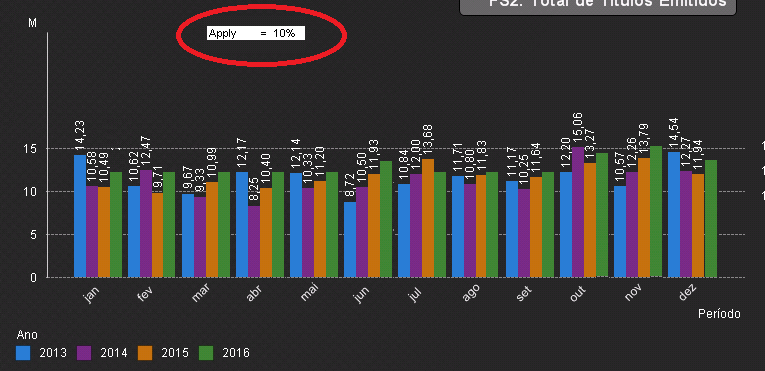
I need to create a bar chart with a variable bar depending on a setted value through an input box.
Example:
Each month of 2016 (green bar) should be the same value of 2015 plus 10%.
Is this possibe? Any suggestions?

 swuehl
- Mark as New
- Bookmark
- Subscribe
- Mute
- Subscribe to RSS Feed
- Permalink
- Report Inappropriate Content
Try a bar chart with dimension Month and 4 expressions ,like
=Sum({<Year = {2013}>} Sales)
=Sum({<Year = {2014}>} Sales)
=Sum({<Year = {2015}>} Sales)
=Sum({<Year = {2015}>} Sales) * (1+vPercentage)
vPercentage being your variable set in the input box

 HirisH_V7
- Mark as New
- Bookmark
- Subscribe
- Mute
- Subscribe to RSS Feed
- Permalink
- Report Inappropriate Content
Hi,
May be like this,
INPUTFIELD InputVar;
Data:
LOAD *,
0 as InputVar
 INLINE [
    Customer , Sales
    1, 2200
    2, 1100
    3, 1200
    4, 1100
    5, 2100
    6, 12000
];
Front end :
Bar Chart with,
Dimension :
Customer
=ValueList('Sales')
Expressions:
=if(ValueList('Sales'),'Sales',Sum(Sales))
=if(ValueList('Sales'),'Sales',InputVar)
By Using Value list will call both of the expression into a bar like this,

Hope this Helps,
PFA,
Hirish