Unlock a world of possibilities! Login now and discover the exclusive benefits awaiting you.

Announcements
Share your agentic AI experience, learn from others, and earn a new badge: Put Agentic AI to Work
- Qlik Community
- :
- All Forums
- :
- QlikView
- :
- Best chart to implement??
Options
- Subscribe to RSS Feed
- Mark Topic as New
- Mark Topic as Read
- Float this Topic for Current User
- Bookmark
- Subscribe
- Mute
- Printer Friendly Page
Turn on suggestions
Auto-suggest helps you quickly narrow down your search results by suggesting possible matches as you type.
Showing results for

Not applicable
2016-12-19
12:23 AM
- Mark as New
- Bookmark
- Subscribe
- Mute
- Subscribe to RSS Feed
- Permalink
- Report Inappropriate Content
Best chart to implement??
Hi Experts,
I need to show customer and product current year vs prior year sales in a single chart(object).
Can someone please suggest me a best ways(chart) to implements this??
Thanks,
Bhavesh
1,312 Views
1 Solution
Accepted Solutions

 adamdavi3s
Master
2016-12-19
04:39 AM
- Mark as New
- Bookmark
- Subscribe
- Mute
- Subscribe to RSS Feed
- Permalink
- Report Inappropriate Content
This is always a good starter for ten:
http://estebanmoro.org/wp-content/uploads/2012/08/choosing_a_good_chart-1.jpg
1,237 Views
4 Replies
Not applicable
2016-12-19
12:31 AM
Author
- Mark as New
- Bookmark
- Subscribe
- Mute
- Subscribe to RSS Feed
- Permalink
- Report Inappropriate Content
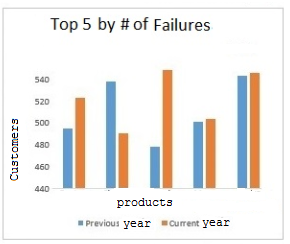
This is a better way to depict.
1,237 Views
Not applicable
2016-12-19
12:55 AM
Author
- Mark as New
- Bookmark
- Subscribe
- Mute
- Subscribe to RSS Feed
- Permalink
- Report Inappropriate Content
Hi,
Thank you for your quick response.
As per the image I understood that I can only show products cy and py then what about customer??
Thanks,
Bhavesh
1,237 Views


2016-12-19
02:27 AM
- Mark as New
- Bookmark
- Subscribe
- Mute
- Subscribe to RSS Feed
- Permalink
- Report Inappropriate Content
Do you like this? Or try with Scatter chart
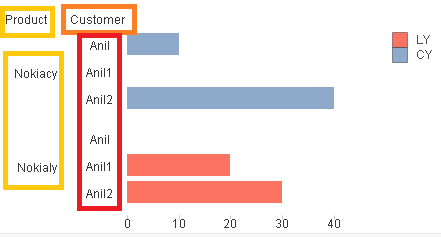
Best Anil, When applicable please mark the correct/appropriate replies as "solution" (you can mark up to 3 "solutions". Please LIKE threads if the provided solution is helpful
1,237 Views
adamdavi3s
Master
2016-12-19
04:39 AM
- Mark as New
- Bookmark
- Subscribe
- Mute
- Subscribe to RSS Feed
- Permalink
- Report Inappropriate Content
This is always a good starter for ten:
http://estebanmoro.org/wp-content/uploads/2012/08/choosing_a_good_chart-1.jpg
1,238 Views