Unlock a world of possibilities! Login now and discover the exclusive benefits awaiting you.

- Qlik Community
- :
- All Forums
- :
- QlikView
- :
- Re: Dealing %
- Subscribe to RSS Feed
- Mark Topic as New
- Mark Topic as Read
- Float this Topic for Current User
- Bookmark
- Subscribe
- Mute
- Printer Friendly Page

 Joaquin_Lazaro
- Mark as New
- Bookmark
- Subscribe
- Mute
- Subscribe to RSS Feed
- Permalink
- Report Inappropriate Content
Dealing %
Hello:
I have an expression to calculate the % of a total, I need a second expression that accumulate he previous % ... but I'm not able to write it.
Please, could you help me?
This is the expression
NUM( 100 *
SUM( Sales )
/ SUM( TOTAL Sales)
, $(NumberFormat2Dec), DecimalSep, ThousandSep)
And this is the table that i can't get

Which expression i need write in column 2 ??
Thank you very much,
Joaquín
Accepted Solutions
Joaquin_Lazaro
- Mark as New
- Bookmark
- Subscribe
- Mute
- Subscribe to RSS Feed
- Permalink
- Report Inappropriate Content
Hi guys:
The correct expression for column2 is:
= NUM( 100 *
RangeSum(Above(SUM( Sales ), 0, RowNo()))
/ SUM( TOTAL Sales )
, $(NumberFormat2Dec), DecimalSep, ThousandSep)
and it works under two conditions: a) The chart must be a straight table and b) Only with one dimension
Thanks again

 tresB
tresB
- Mark as New
- Bookmark
- Subscribe
- Mute
- Subscribe to RSS Feed
- Permalink
- Report Inappropriate Content
rangesum (above(sum(x),0,2))
//'x' should be replaced by the label of the first column/Column(1).
Joaquin_Lazaro
- Mark as New
- Bookmark
- Subscribe
- Mute
- Subscribe to RSS Feed
- Permalink
- Report Inappropriate Content
Thanks tresesco
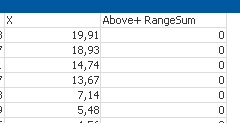
I've written rangesum (above(sum(x),0,2)) in second expression and tagged column 1 as x
The value of column2 is 0 for all the rows

 er_mohit
- Mark as New
- Bookmark
- Subscribe
- Mute
- Subscribe to RSS Feed
- Permalink
- Report Inappropriate Content
Try this
rangesum(above(sum(Sales),0,rowno(total)))
Joaquin_Lazaro
- Mark as New
- Bookmark
- Subscribe
- Mute
- Subscribe to RSS Feed
- Permalink
- Report Inappropriate Content

tresB
- Mark as New
- Bookmark
- Subscribe
- Mute
- Subscribe to RSS Feed
- Permalink
- Report Inappropriate Content
Sorry, Sum() should not be there. try:
rangesum (above(x,0,RowNo(Total)))
RowNo(Total) - would be required to sum up till the end.
Joaquin_Lazaro
- Mark as New
- Bookmark
- Subscribe
- Mute
- Subscribe to RSS Feed
- Permalink
- Report Inappropriate Content
Hi:
= rangesum(above(X,0,2))
= rangesum(above('X',0,2))
In both cases I get 0 for all the rows ... the first is marked as wrong expression it editor because is not a field name (X is the tag of the expression
Joaquin_Lazaro
- Mark as New
- Bookmark
- Subscribe
- Mute
- Subscribe to RSS Feed
- Permalink
- Report Inappropriate Content
Thanks ER.Mohit:
Column 2 values are 0 too
Joaquin_Lazaro
- Mark as New
- Bookmark
- Subscribe
- Mute
- Subscribe to RSS Feed
- Permalink
- Report Inappropriate Content
Hi guys:
The correct expression for column2 is:
= NUM( 100 *
RangeSum(Above(SUM( Sales ), 0, RowNo()))
/ SUM( TOTAL Sales )
, $(NumberFormat2Dec), DecimalSep, ThousandSep)
and it works under two conditions: a) The chart must be a straight table and b) Only with one dimension
Thanks again
