Unlock a world of possibilities! Login now and discover the exclusive benefits awaiting you.
- Qlik Community
- :
- All Forums
- :
- QlikView
- :
- Re: Expression reuse
- Subscribe to RSS Feed
- Mark Topic as New
- Mark Topic as Read
- Float this Topic for Current User
- Bookmark
- Subscribe
- Mute
- Printer Friendly Page
- Mark as New
- Bookmark
- Subscribe
- Mute
- Subscribe to RSS Feed
- Permalink
- Report Inappropriate Content
Expression reuse
Hello Got a pivot table showing AR Ageing (check attached) document
in the copy that I've attached I have the Invoice Number 84035 with amount 421,444.26 and No. of Days =3
then I got the remaining invoices with number of days = 2 and 1
What I want now is to create a new pivot table showing for each customer the amount of invoices whose ageing days is between 1, and 2
and those whose ageing is >2
i.e. the pivot table shows customer name, then expression 1 sum(amount) where ageing is between 1,and 2 and a second expression showing the amount where ageing is >2
i.e. for the available customer show:
421,444.26
and on the second column show
| 25029.54 |
of course by reusing the expression used to calculate ageing
Please advise
- Tags:
- sunny t
- « Previous Replies
-
- 1
- 2
- Next Replies »
- Mark as New
- Bookmark
- Subscribe
- Mute
- Subscribe to RSS Feed
- Permalink
- Report Inappropriate Content
this works if one expression is needed in the report
but I have other expressions to add like the current balance of the customer and I don't want to classify this
- Mark as New
- Bookmark
- Subscribe
- Mute
- Subscribe to RSS Feed
- Permalink
- Report Inappropriate Content
Please use interval match for your requirment. Below is the doc with examples.
Catergorize our data based on ageing, then use it as dimension in your pivot table
- Mark as New
- Bookmark
- Subscribe
- Mute
- Subscribe to RSS Feed
- Permalink
- Report Inappropriate Content
this works if I have only one expression in the chart
but I got several expressions
- Mark as New
- Bookmark
- Subscribe
- Mute
- Subscribe to RSS Feed
- Permalink
- Report Inappropriate Content
Hi ali_hijazi,
So as per my understanding, there will be more than one expression under same bucket right ?
Do you want something like this-
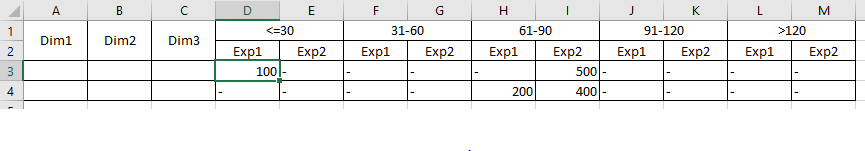
Thanks,
Joy
- Mark as New
- Bookmark
- Subscribe
- Mute
- Subscribe to RSS Feed
- Permalink
- Report Inappropriate Content
yes
- « Previous Replies
-
- 1
- 2
- Next Replies »