Unlock a world of possibilities! Login now and discover the exclusive benefits awaiting you.

- Qlik Community
- :
- All Forums
- :
- QlikView
- :
- Re: How to show not selected data points in a scat...
- Subscribe to RSS Feed
- Mark Topic as New
- Mark Topic as Read
- Float this Topic for Current User
- Bookmark
- Subscribe
- Mute
- Printer Friendly Page

- Mark as New
- Bookmark
- Subscribe
- Mute
- Subscribe to RSS Feed
- Permalink
- Report Inappropriate Content
How to show not selected data points in a scatter plot
Hello,
I would like to show all the data points in a scatter plot :
- in color those selected
- in light gray those who are not selected.
Does anyone have a solution for this?
Thank you for your answers!
Accepted Solutions

 sunny_talwar
- Mark as New
- Bookmark
- Subscribe
- Mute
- Subscribe to RSS Feed
- Permalink
- Report Inappropriate Content
In your expression, ignore all selections using {1}, but don't use it in your background color expression. It might be easier if you can share a sample where we can demonstrate this.
Best,
Sunny
sunny_talwar
- Mark as New
- Bookmark
- Subscribe
- Mute
- Subscribe to RSS Feed
- Permalink
- Report Inappropriate Content
In your expression, ignore all selections using {1}, but don't use it in your background color expression. It might be easier if you can share a sample where we can demonstrate this.
Best,
Sunny

 el_aprendiz111
- Mark as New
- Bookmark
- Subscribe
- Mute
- Subscribe to RSS Feed
- Permalink
- Report Inappropriate Content
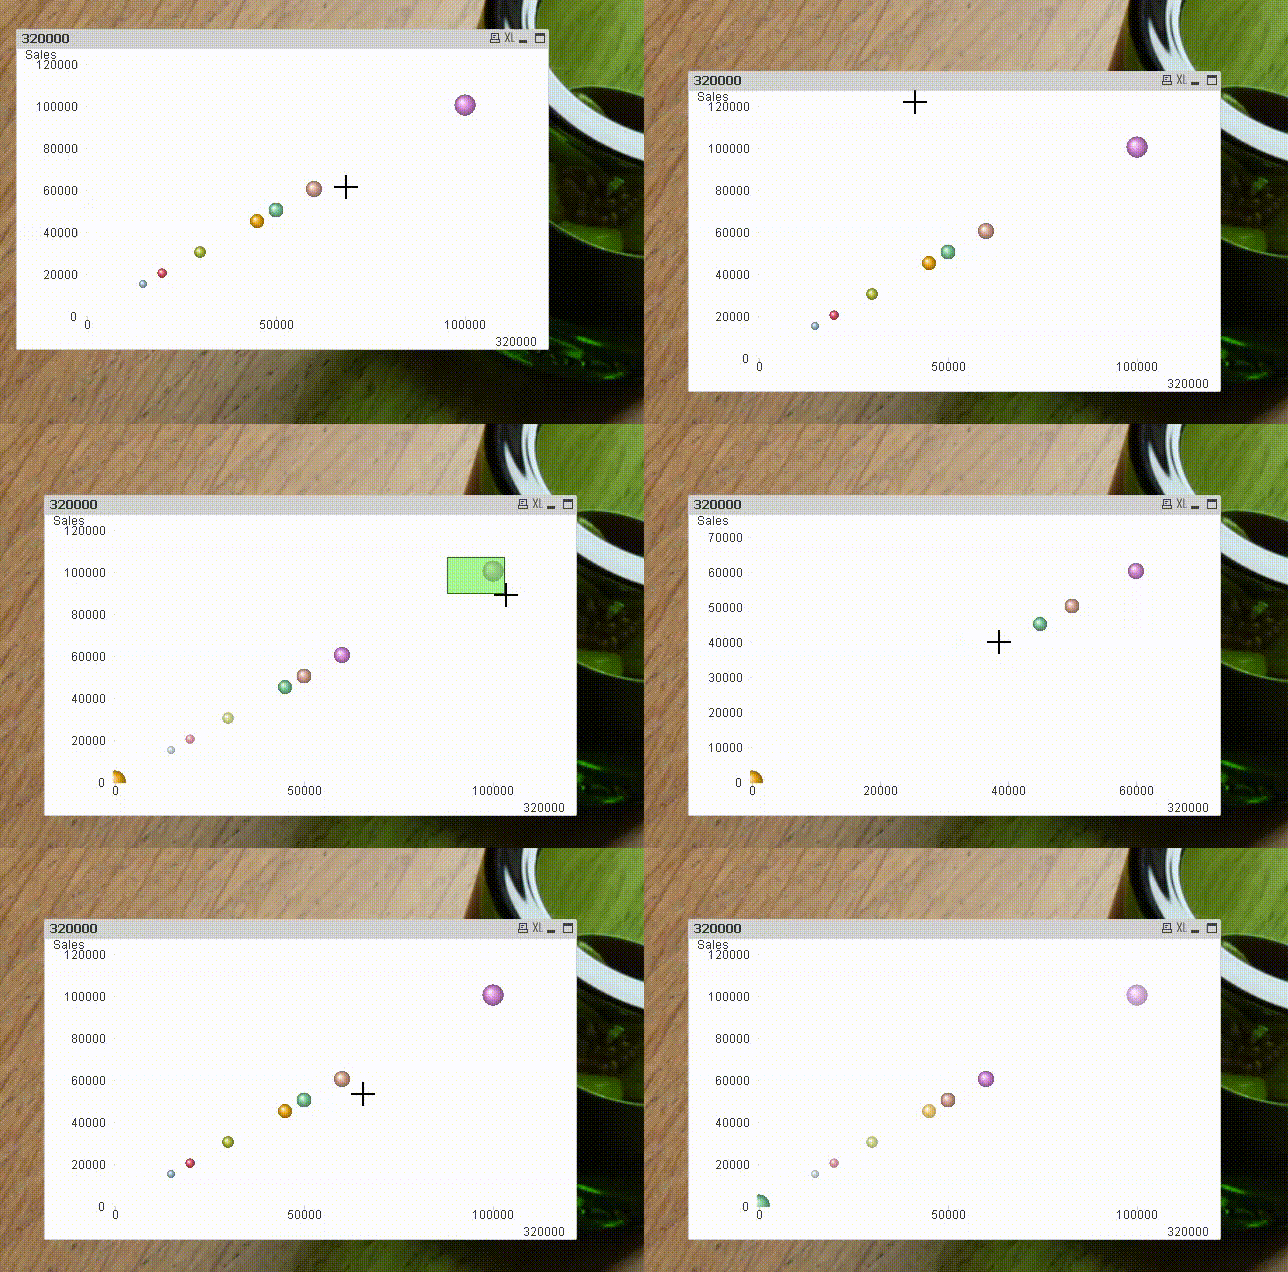
Hi:
- Mark as New
- Bookmark
- Subscribe
- Mute
- Subscribe to RSS Feed
- Permalink
- Report Inappropriate Content
Hello Sunny and fer,
Thank you for your answers.
Sunny, I have tried out your solution and it works great. I have even changed the background colors. You can find my application here attached.
fer, I didn't know this feature existed! It is quite handy. However, it shows only the data points which are close to the selection and not all data points.
Kind regards,
Tanja
sunny_talwar
- Mark as New
- Bookmark
- Subscribe
- Mute
- Subscribe to RSS Feed
- Permalink
- Report Inappropriate Content
Awesome!! I am glad you were able to figure it out. Its often time difficult to get the point across, but I am glad it was easy for you to understand and you were able to pick up from the clues.
I would suggest you to close this thread by marking correct and helpful responses.
Qlik Community Tip: Marking Replies as Correct or Helpful
Best,
Sunny