Unlock a world of possibilities! Login now and discover the exclusive benefits awaiting you.

- Qlik Community
- :
- All Forums
- :
- QlikView
- :
- Max Function
- Subscribe to RSS Feed
- Mark Topic as New
- Mark Topic as Read
- Float this Topic for Current User
- Bookmark
- Subscribe
- Mute
- Printer Friendly Page

- Mark as New
- Bookmark
- Subscribe
- Mute
- Subscribe to RSS Feed
- Permalink
- Report Inappropriate Content
Max Function
Hello Friends
Using the below value I am trying to create a pivot table top in each subject and score.
I tried the max function =Max(Score) in the expression and Class in the dimension its fine but when I add Name in the dimension the chart showing the wrong result.
Could you please advise me, how to implement this in a pivot table.
LOAD * Inline [
Class, Name, Score
English, James,5
English, Sneha,6
English, Ram,10
Maths,Troy,1
Maths,Khan,5
Maths,Alif,8
Maths,James,9
Science,Sneha,5
Science,Ram,7
History,Ram,9
History,Khan,3
History,Troy,1
History,James,2
];
Regards
Joe
- Tags:
- new_to_qlikview
Accepted Solutions

 tresB
tresB
- Mark as New
- Bookmark
- Subscribe
- Mute
- Subscribe to RSS Feed
- Permalink
- Report Inappropriate Content

 anbu1984
- Mark as New
- Bookmark
- Subscribe
- Mute
- Subscribe to RSS Feed
- Permalink
- Report Inappropriate Content
=Aggr(Max(Score) ,Class)
- Mark as New
- Bookmark
- Subscribe
- Mute
- Subscribe to RSS Feed
- Permalink
- Report Inappropriate Content
in the expression write : AGGR(Max(Score),Class)
dimension : Name
tresB
- Mark as New
- Bookmark
- Subscribe
- Mute
- Subscribe to RSS Feed
- Permalink
- Report Inappropriate Content
Dimension: Class
Exp1: FirstSortedValue(Name, -Score)
Exp2: Max(Score)

 martinpohl
- Mark as New
- Bookmark
- Subscribe
- Mute
- Subscribe to RSS Feed
- Permalink
- Report Inappropriate Content
use
max(total <Class> Score)
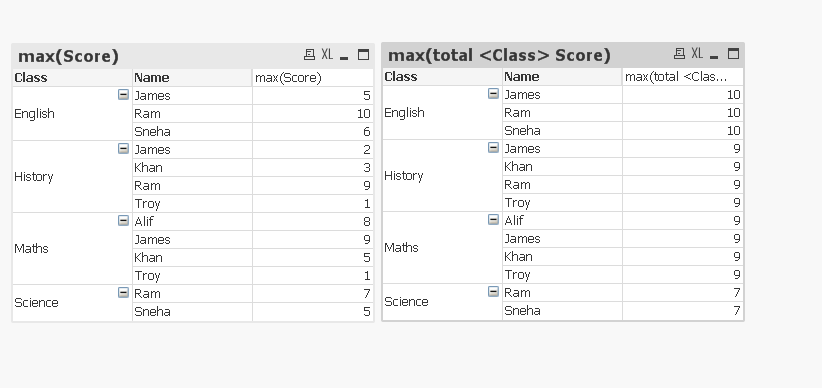
Regards
- Mark as New
- Bookmark
- Subscribe
- Mute
- Subscribe to RSS Feed
- Permalink
- Report Inappropriate Content
Hi Anbu,
Thanks for u r reply but the result is wrong for instance Ram is the topper in English but as per your result James.
Regards
Joe
- Mark as New
- Bookmark
- Subscribe
- Mute
- Subscribe to RSS Feed
- Permalink
- Report Inappropriate Content