Unlock a world of possibilities! Login now and discover the exclusive benefits awaiting you.

- Qlik Community
- :
- All Forums
- :
- QlikView
- :
- Re: Re: Mini Waterfall in Table
- Subscribe to RSS Feed
- Mark Topic as New
- Mark Topic as Read
- Float this Topic for Current User
- Bookmark
- Subscribe
- Mute
- Printer Friendly Page

 fheidenstecker
- Mark as New
- Bookmark
- Subscribe
- Mute
- Subscribe to RSS Feed
- Permalink
- Report Inappropriate Content
Mini Waterfall in Table
Hi there,
i was trying to create a mini waterfall in a straight table.
Creating a waterfall chart in QlikView is really easy. I used a rangesum / above combination for the offset, works like a charm!
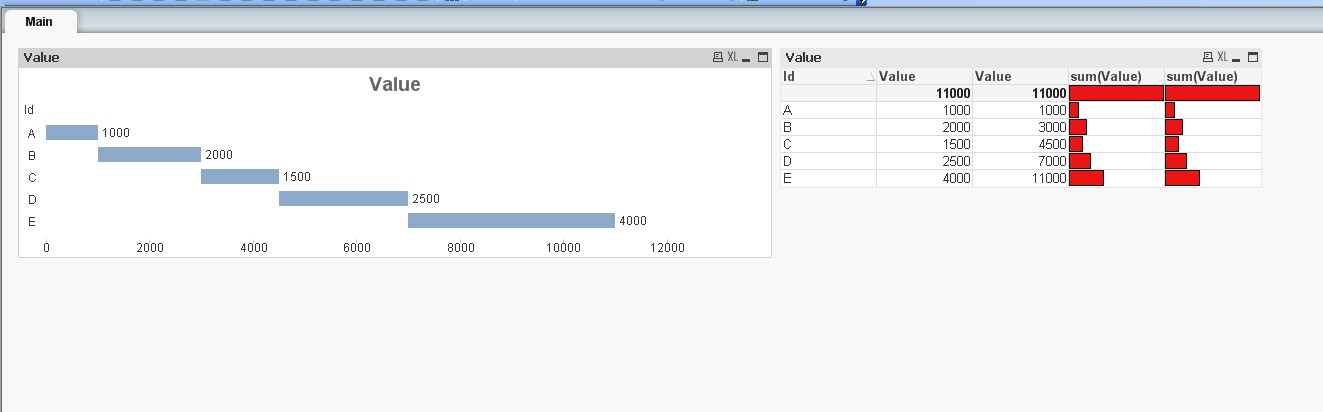
But now i want to mimic the waterfall chart in a straight table, cause i want to have more measures per line.
My idea was to use 2 Segments, using the first one as the offset and then turning it to foll transparency
I tried to copy & paste my offset formula from the chart to the gauge starting value. But no success. I tried to statically set the starting value based on RowNo(), but obviously i can't reference the row number from within this starting measure ?!?
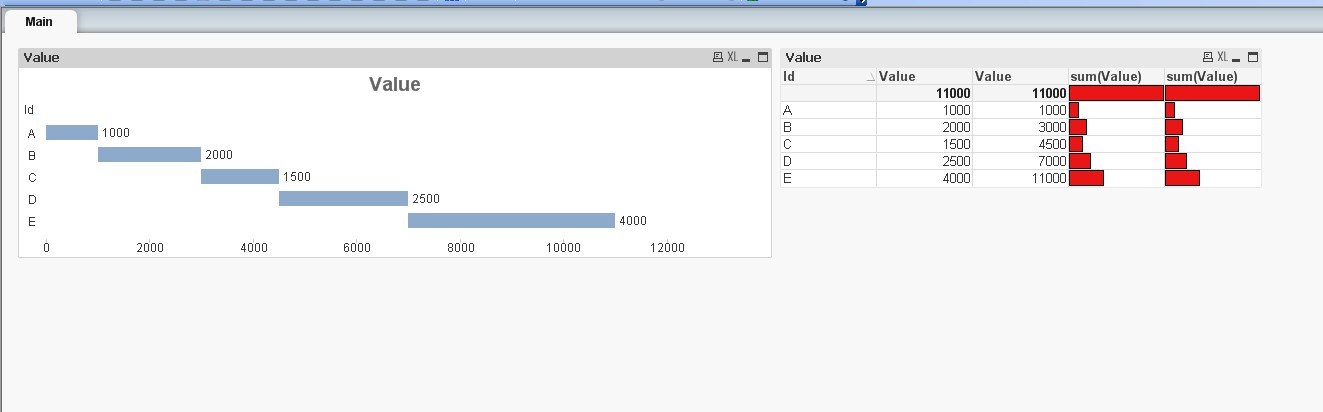
Does anyone have an idea how to resolve this?
I would be greatful for suggestions,
Fabian
Accepted Solutions
 rbecher
- Mark as New
- Bookmark
- Subscribe
- Mute
- Subscribe to RSS Feed
- Permalink
- Report Inappropriate Content
Hi Fabian,
I think this is not possible because "Lower Bound" will only calculated once per chart, not per line. I tried to set dynamically in the attached example but doesn't work...
- Ralf
rbecher
- Mark as New
- Bookmark
- Subscribe
- Mute
- Subscribe to RSS Feed
- Permalink
- Report Inappropriate Content
Hi Fabian,
I think this is not possible because "Lower Bound" will only calculated once per chart, not per line. I tried to set dynamically in the attached example but doesn't work...
- Ralf
fheidenstecker
- Mark as New
- Bookmark
- Subscribe
- Mute
- Subscribe to RSS Feed
- Permalink
- Report Inappropriate Content
Thanks for your effort, Ralf.
Do you think it is a Bug or a feature that the boundry is only calculated per chart. I mean, to draw the gauge, calculation has to be done per line, so from my point of view, that is a mixed logic ?
Cheer,
Fabian
rbecher
- Mark as New
- Bookmark
- Subscribe
- Mute
- Subscribe to RSS Feed
- Permalink
- Report Inappropriate Content
I think it's a feature. The segment size is static (per chart), the filling/coloring is dynamic (per line).

 marcus_sommer
- Mark as New
- Bookmark
- Subscribe
- Mute
- Subscribe to RSS Feed
- Permalink
- Report Inappropriate Content
Perhaps the repeat() function could be an alternative - it depends from the font-type and the adjustment from repeat-counter is tricky, but this approach could work.
- Marcus
rbecher
- Mark as New
- Bookmark
- Subscribe
- Mute
- Subscribe to RSS Feed
- Permalink
- Report Inappropriate Content
Hey, this is a nice and interesting old schoolish ASCII art. Never thought of it.. 😉
